You might also like


Vector Templates: Gradient Circular Diagram Infographic – Free Vector Download
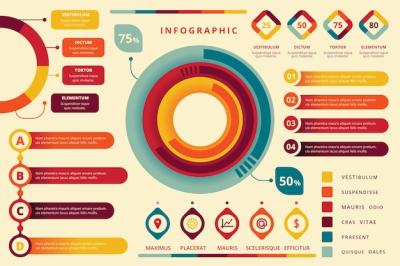
Gradient Circular Diagram Infographic: A Versatile Tool for Visualizing Data
Enhance the impact of your data presentation with our Gradient Circular Diagram Infographic. This versatile vector template is designed to assist you in conveying complex information in a visually appealing manner. Whether you need to showcase statistics, data analytics, or any other form of information, this infographic is the perfect solution.
A Modern and Stylish Design
Our circular diagram template offers a sleek and modern design that will captivate your audience. The gradient color palette adds depth and dimension to your visuals, making them more engaging and memorable. With its clean lines and clear hierarchy, this infographic effectively communicates the key data points and helps users quickly grasp the main message.
Effortless Customization
Create impactful visuals that align with your brand identity and message without any hassle. Our template comes in two file formats - EPS and JPG - giving you flexibility in using it with different software and platforms. Easily modify the elements, colors, and text to suit your specific needs and requirements. Whether you are a seasoned designer or a beginner, customizing this gradient circular diagram infographic is a breeze.
Optimized for Various Applications
From creating informative reports to designing engaging presentations or infographics for social media, this vector template is optimized for a wide range of applications. Stand out from the competition with visually stunning data visualizations that leave a lasting impression on your audience.
Boost Your Data Visualization Efforts
In today's data-driven world, effective data visualization is crucial for conveying complex information in a simple and understandable way. Our gradient circular diagram infographic empowers you to communicate your data findings effectively, making them more accessible and impactful.
Key Features:
- Modern and stylish design
- Gradient color palette for added visual appeal
- Effortless customization with EPS and JPG file formats
- Optimized for various applications such as reports, presentations, and social media
- Boosts your data visualization efforts
Unlock the potential of your data and captivate your audience with our Gradient Circular Diagram Infographic. Download the EPS or JPG file from HDStockImages.com and start creating impactful visuals today.