You might also like


Vector Templates for Ten Management Slide
Introduction
Welcome to the world of management slide templates! This collection of ten professionally designed templates is bound to make your presentations stand out. Whether you're presenting project data, workflows, or business processes, these templates have got you covered. With their modern and sleek design, your audience will be truly impressed.
Key Features
- Presentation elements: These templates offer a wide range of presentation elements that will make your content visually appealing and engaging.
- Project presentation: Communicate your project details effectively with these templates, making it easier for your audience to understand the key points.
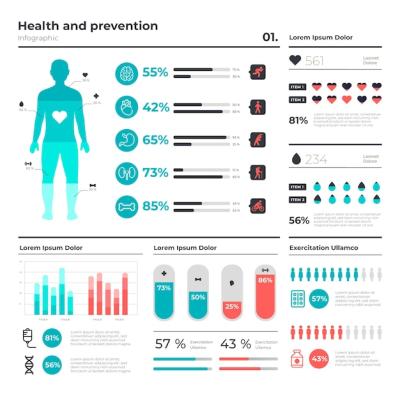
- Infographic presentation: Create impactful infographics to present complex data in a visually appealing format.
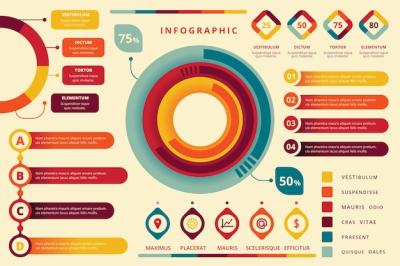
- Cycle chart: Visualize your cyclic processes and demonstrate the flow of events effortlessly with the cycle chart feature.
- Workflow: Illustrate the workflow of any process using these templates, allowing your audience to visualize the steps involved.
- Circle percentage: Use the circle percentage feature to represent numerical data effectively and enhance audience comprehension.
- Circle process: Showcase various stages of a process using the circle process feature, making it easier to understand complex concepts.
- Circle graph: Present data in a dynamic and visually pleasing manner with the circle graph feature, making your presentations more impactful.
- Cycle diagram: Utilize the cycle diagram feature to showcase the various interconnected components of a system or process.
- Cycle infographic: Capture the attention of your audience with the cycle infographic feature, which combines the power of infographics and cyclic processes.
- Infographic layout: These templates offer a variety of infographic layouts to help you present information in an engaging and visually appealing manner.
- Text layout: With different text layouts available, you can choose the one that best suits your content, ensuring effective communication.
- Infographic percentage: Visualize data in percentage form with the infographic percentage feature, making statistical information more digestible for your audience.
- Percentage chart: Use the percentage chart feature to represent data in a graphical format, facilitating better understanding.
- Data infographic: Transform complex data into informative visuals with the data infographic feature, making your presentations more dynamic and engaging.
- Background infographic: Choose from a variety of background infographics to add depth and visual interest to your presentations.
- Infographic: Utilize the power of infographics to present information in a visually appealing and concise manner, enhancing audience engagement.
- Circle diagram: Effectively represent data or concepts using the circle diagram feature, making your presentations more visually engaging.
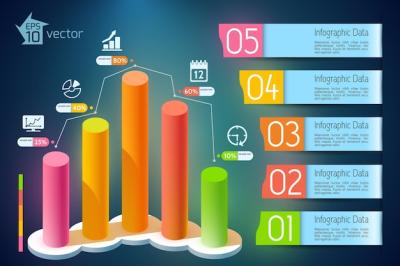
- Graph: Present data trends, comparisons, and relationships using the graph feature, enabling your audience to grasp key insights effortlessly.
- Infographic design: These templates are designed to be visually stunning, ensuring that your presentations make a lasting impression.
- Flow diagram: Illustrate various processes or systems using flow diagrams, making complex concepts easier to understand.
- Graph chart: Use the graph chart feature to present data and trends in a clear and visually pleasing way.
- Flow charts: Present processes or workflows step-by-step with flow charts, allowing your audience to follow along seamlessly.
- Infographic title: Grab your audience's attention with impactful infographic titles, making your presentations more memorable.
- Information chart: Present complex information in a concise and visually appealing manner with the information chart feature.
- Data chart: Visualize data effectively with the data chart feature, making it easier for your audience to comprehend.
- Process flow: Showcase the flow of any process, making it easier for your audience to understand the sequence of events.
- Infographic set: With this set of templates, you have everything you need to create stunning and engaging infographics.
- Infographic elements: These templates offer a wide range of infographic elements to help you craft visually appealing and informative presentations.
- Chart: Present data effectively with the chart feature, enhancing your audience's understanding of numerical information.
- Data graph: Use the data graph feature to illustrate data trends and comparisons, facilitating better comprehension.
- Business diagram: Communicate business concepts and processes with clarity using the business diagram feature.
File Type
The file types available for these management slide templates are EPS and JPG. Both formats offer high-quality resolution and can be easily used in various graphic design software and programs.
Category
These templates belong to the Vector Templates category, which means they are crafted specifically to cater to the needs of professionals who require visually appealing graphics for their presentations. The Vector Templates category offers a wide range of options to help you create captivating visuals with ease.