You might also like


Vector Templates: Colorful Pie Chart Infographic
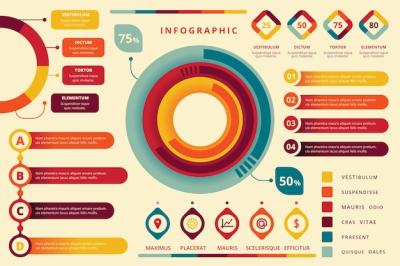
Colorful Pie Chart Infographic
Introduction:
Welcome to HDStockImages, where you can find a high-quality Vector Templates file that offers a vibrant and visually appealing colorful pie chart infographic. This file includes EPS and JPG formats, providing convenience and versatility for your design projects.
About the Product:
Our Colorful Pie Chart Infographic is the perfect solution for creating visually engaging presentations, reports, or websites. This vector template offers a range of options to effectively display your data and information. With its eye-catching design and comprehensive features, you can effectively communicate complex information in a clear and concise manner.
Key Features:
Our Colorful Pie Chart Infographic provides an extensive range of features to enhance your data visualization:
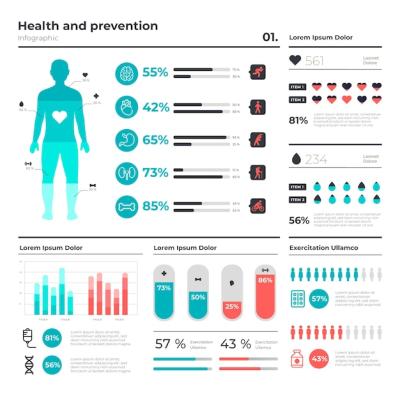
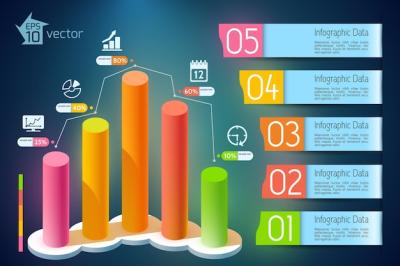
- Bar Chart: Visualize data with bar charts
- Graph Bar Chart: Create informative and visually appealing bar charts
- Pie Diagram: Display data using pie diagrams
- Infographic Bar: Add a touch of elegance with infographic bar charts
- Infographic Bar Chart: Combine data and design with infographic bar charts
- Graphic Chart: Present data in an engaging and visually appealing manner
- Pie Graph: Showcase data through pie graphs
- Pie Chart: Create impactful and easy-to-understand pie charts
- Pie Chart Graph: Optimize data visualization with pie chart graphs
- Pie Charts: Utilize various pie chart options
- Graph Chart: Illustrate data using graph charts
- Options: Customize your charts and graphs with various options
- Infographic Graph: Visualize data creatively with infographic graphs
- Info Graph: Present complex data in a visually appealing way
- Pie Chart Infographic: Demonstrate data with visually appealing pie chart infographics
- Graph: Choose from a wide range of graph options
- Infographic Elements: Enhance your infographic with additional elements
- Business Infographic: Effectively convey business-related information
- Information Graphic: Present complex information in a visually appealing manner
- Diagram: Utilize diagrams to showcase data
- Chart: Create clear and concise charts for your data
- Info: Present information in a visually appealing format
- Infographic Chart: Combine data and design with infographic charts
- Business Diagram: Display business-related information effectively
- Infographic Diagram: Utilize diagrams to showcase complex information
- Information Chart: Choose from a wide range of chart options
- Infographic: Create visually appealing and informative infographics
- Info Graphics: Display complex information with visually appealing graphics
- Process: Showcase processes in a visually engaging way
- Data Infographic: Visualize data with beautiful and informative infographics
- Infographic Graphics: Add visually appealing graphics to your infographics
- Data Chart: Present data in a clear and concise chart format
- Infographic Shapes: Enhance your infographics with various shapes
- Statistics Infographic: Present statistical data in an engaging manner
- Process Chart: Visualize processes using informative charts
Conclusion:
Whether you need to present information in a striking and visually appealing way or create captivating visual content, our Colorful Pie Chart Infographic is your go-to solution. With its versatile file formats (EPS and JPG) and extensive range of features, you can effectively communicate data, information, and ideas in a visually engaging manner. Explore the world of data visualization and design with HDStockImages today!


