You might also like


Timeline and Percentage Chart Templates for Presentations – Free to Download
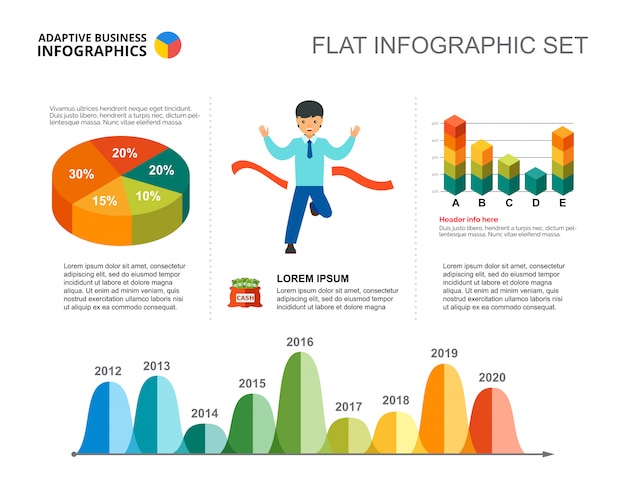
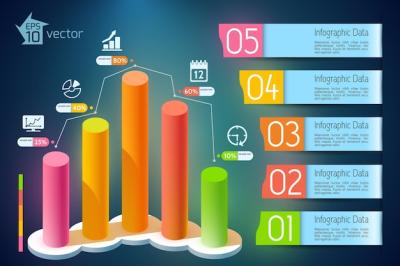
Timeline and Percentage Chart Template for Presentation
If you are looking to create engaging presentations, the Timeline and Percentage Chart Template is perfect for showcasing your data in a clear and visually appealing way. This template is designed to bring life to your projects, making it easier for your audience to understand complex information at a glance.
Key Features of the Template
- File Formats: Available in EPS and JPG formats, ensuring compatibility with various design tools.
- Versatile Usage: Ideal for business presentations, educational purposes, and personal projects.
- Customizable Elements: Easily modify colors, sizes, and fonts to match your branding or personal style.
- High-Quality Graphics: Crisp and clear visuals that do not lose quality when resized or edited.
Benefits of Using a Timeline and Percentage Chart
Using a timeline and percentage chart in your presentation helps convey important information in an organized manner. Here are a few benefits:
- Enhances understanding of project timelines.
- Visualizes progress with percentage indicators.
- Makes it easier to track milestones and objectives.
Who Can Use This Template?
This template is suitable for everyone, whether you are a student, teacher, business professional, or a content creator. It caters to:
- Companies looking to present quarterly results.
- Educators designing lesson plans.
- Students preparing for class projects.
- Freelancers showcasing their work progress.
How to Get Started
To use the Timeline and Percentage Chart Template, simply download the file from HD Stock Images. Once you have the template, you can open it in your preferred design software and start customizing it to fit your needs.
With this template, you will find it easier to create impactful presentations that leave a lasting impression on your audience. Whether it's a business update or a school project, using a timeline and percentage chart can make your information much clearer and more relatable.
Final Thoughts
The Timeline and Percentage Chart Template is an essential tool for anyone looking to improve their presentation skills. With its user-friendly design and customizable features, you can easily create compelling visual stories that resonate with your audience. Take your presentations to the next level with this valuable resource!