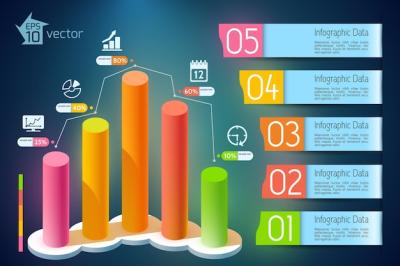
Pie Chart Infographic Business Design – Free Download
Pie Chart Infographic Business Design
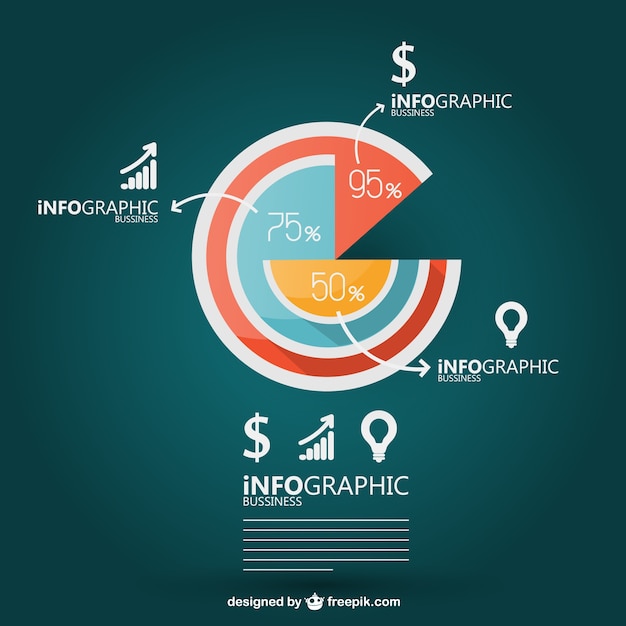
Every professional knows the importance of clear and visually appealing presentations. This Pie Chart Infographic Business Design is perfect for those looking to enhance their reports and presentations with striking visuals. Whether you are in marketing, finance, or any field that relies on data, this template can help simplify complex information.
Why Choose Our Vector Templates?
Our vector templates are not just about style; they are designed for effectiveness. Here are some reasons to consider our Pie Chart Infographic:
- Customizable: You can easily change colors, sizes, and text to match your brand or project.
- High Quality: Available in EPS and JPG formats, ensuring your graphics remain sharp and clear.
- User-Friendly: Perfect for both beginners and experienced designers. You donât need advanced skills to create stunning visuals.
Features of the Pie Chart Infographic Design
This infographic design offers numerous features that make it stand out:
- Multiple Styles: The design includes various pie chart styles, perfect for showcasing different types of data.
- Data Visualization: It helps represent percentages and ratios clearly, making complex data easy to understand.
- Versatile Use: Suitable for business reports, presentations, or even educational materials.
How to Use This Template
Using our Pie Chart Infographic is straightforward. Follow these simple steps:
- Download: Purchase and download the EPS or JPG files from our website.
- Edit: Open the template in your preferred graphic design software to customize it.
- Present: Use the edited infographic in your presentations, reports, or social media posts.
Where to Use Pie Chart Infographics?
Pie Chart Infographics can be beneficial in various contexts, including:
- Business Presentations: Perfect for pitching ideas or explaining market research.
- Reports: A valuable addition to annual reports or budget proposals to present data clearly.
- Social Media: Bright and engaging visuals for sharing statistics with your audience.
Final Thoughts
The Pie Chart Infographic Business Design is a fantastic tool for anyone who wants to present data in a captivating and easy-to-understand manner. With its high-quality formats and customizable features, it is designed to meet a variety of professional needs. Transform the way you communicate data and make your presentations stand out.
