Gradient Radar Chart Infographic – Download Free Stock Photo
Gradient Radar Chart Infographic
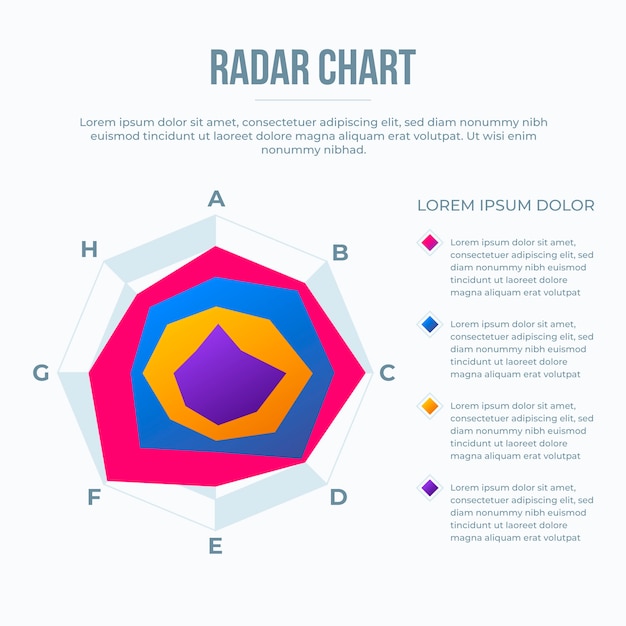
If you are looking for a visually appealing and informative way to present data, our Gradient Radar Chart Infographic is a great choice. This template is designed to help you showcase multiple dimensions of data in an easy-to-understand format. Whether for business presentations, academic reports, or marketing strategies, this infographic will make your data stand out.
What is a Radar Chart?
A radar chart, also known as a spider chart or web chart, displays multivariate data in a two-dimensional format. It allows you to compare different variables and see how they relate to each other. With our gradient design, your data will not only be clear but also visually engaging, making it easier for your audience to grasp the information.
Why Choose Our Gradient Radar Chart Infographic?
- Easy to Customize: The vector files in EPS format can be easily edited to fit your specific needs. Change colors, labels, or dimensions effortlessly.
- High-Quality Graphics: Our JPG format ensures you have high-resolution images that look professional in any presentation.
- Versatile Usage: Perfect for various applications including marketing materials, business reports, and educational content.
- Time-Saving: Ready-to-use design means you can focus on your content rather than spending hours on design work.
How to Use the Gradient Radar Chart Infographic
Using our infographic template is simple. Follow these steps for an effective presentation:
- Download the file in your preferred format (EPS or JPG).
- Open the file in your design software or presentations tool.
- Edit the chart to include your own data points and labels.
- Adjust the colors if needed to match your brand or presentation style.
- Save and incorporate the chart into your final presentation or document.
Who Can Benefit from This Template?
This infographic is ideal for:
- Business professionals looking to present data clearly.
- Teachers and students who need to illustrate complex information.
- Marketers aiming to visualize competing products or services.
- Researchers presenting survey data or findings.
Get Started Today!
Enhance your presentations and reports with our Gradient Radar Chart Infographic. It's an effective way to communicate important information while keeping your audience engaged and interested. Visit HD Stock Images to download your template today!
