Geographic Infographic Templates with Statistics
Description:
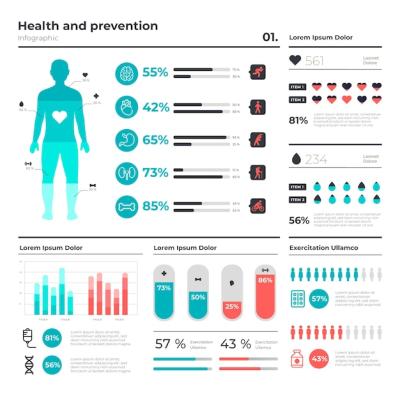
Introducing our collection of Geographic infographic with statistics templates! Ideal for adding visual appeal and clarity to your presentations, reports, and web content, these templates are designed to make complex data easy to understand.
Infographic Bar Charts and Graphs
Our infographic templates include a variety of bar charts and graphs that allow you to showcase statistical data in a visually appealing format. From line graphs displaying growth trends to stacked bar charts comparing different categories, these templates provide a wide range of options to present your information.
Chart and Diagram Templates
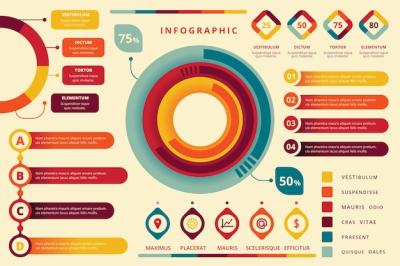
Looking for a chart or diagram template for your next project? Look no further! Our collection includes a diverse range of chart templates, including pie charts, flowcharts, and process diagrams. These visually engaging templates make it easy to illustrate complex processes or present information in a concise and organized manner.
Infographic Graphics and Elements
In addition to charts and diagrams, our templates also feature a variety of infographic graphics and elements. These include icons, illustrations, and symbols that can be easily customized and integrated into your designs. Whether you're creating a business infographic, marketing presentation, or educational material, our graphics and elements will add visual interest and professionalism to your content.
EPS and JPG File Types
Our Geographic infographic with statistics templates are available in two file types: EPS and JPG. EPS files are ideal for professional printing and editing, while JPG files are perfect for web use. With both options, you'll have the flexibility to use these templates in a variety of projects and formats.
Vector Templates Category
These infographic templates are part of our Vector Templates category. As vector files, they can be scaled to any size without losing quality, ensuring crisp and clear graphics on all devices and mediums. Whether you're working on a small infographic or a large poster, our templates are designed to meet your needs.
Overall, our Geographic infographic with statistics templates offer a simple and effective way to present complex data and information. With their wide range of options, user-friendly formats, and high-quality graphics, these templates are a must-have for anyone looking to communicate effectively and visually.
Response:
Thank you for your interest in our Geographic infographic with statistics templates! We're thrilled to hear that you're considering using our Vector Templates for your projects. These templates are designed to make data visualization a breeze, allowing you to present information in an engaging and visually appealing manner. With a wide range of options, from bar charts and graphs to chart and diagram templates, you'll have everything you need to create impactful presentations, reports, and web content. Choose between EPS and JPG file types to ensure compatibility with your desired medium, and enjoy the benefits of vector graphics that can be scaled to any size without loss of quality. Feel free to browse our collection and unleash your creativity with our Geographic infographic with statistics templates!
