You might also like


Four phase comparison donut chart template
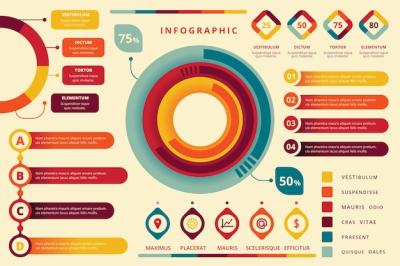
Four Phase Comparison Donut Chart Template
Looking for a visually appealing and informative infographic to enhance your presentations and reports? Look no further than our Four Phase Comparison Donut Chart Template. This professionally designed template is perfect for showcasing data in a visually engaging manner.
Background Infographic
Our template features a captivating background infographic that will instantly capture the attention of your audience. The carefully chosen colors and design elements will add a touch of professionalism to your presentations.
Infographic Presentation
Whether you're presenting at a business meeting or a conference, our template is an ideal choice for creating impactful presentations. It allows you to present complex data in a simplified and visually appealing way, making it easier for your audience to understand and digest the information.
Infographic Layout
The layout of our template is strategically designed to maximize the visual impact of your data. The placement of the donut chart and supporting graph elements ensures clarity and readability, making it easier for your audience to interpret the information being presented.
Logo Infographic
Do you want to showcase your brand or logo in a visually appealing way? Our template provides ample space for incorporating your logo, allowing you to create a cohesive and branded infographic.
Infographics Brochure
Our template is versatile and can be used to create engaging infographics for brochures. Whether you're designing a brochure for a business event, a product launch, or a corporate report, our template will help you create visually appealing and informative brochures.
Text Layout
With our template, you have complete control over the text layout. You can customize the font, size, and color of the text to match your branding and design preferences. This flexibility allows you to create cohesive and visually appealing infographics.
Infographic Title
The title of an infographic plays a crucial role in grabbing the attention of your audience. Our template allows you to create captivating and eye-catching titles that will pique the interest of your viewers and entice them to explore your infographic further.
Infographic Banner
Enhance the visual appeal of your infographic by adding a stunning banner. Our template provides multiple options for incorporating banners, allowing you to create visually stunning and attention-grabbing infographics.
Data Graph
Our template includes a comprehensive data graph that can be easily customized to showcase your data in a visually appealing way. Whether you're presenting sales figures, market trends, or survey results, our template will help you create impactful data graphs.
Statistics
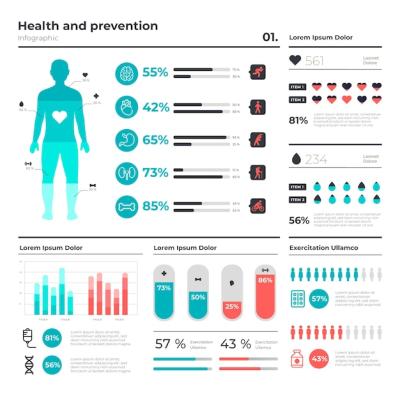
Need to present statistical data in a clear and concise manner? Our template features a visually appealing donut chart that can be used to highlight key statistics and make them more easily understandable for your audience.
Abstract Infographic
If you're looking for a template that breaks away from traditional designs and embraces creativity, our abstract infographic template is the perfect choice. It allows you to experiment with unique design elements and create visually captivating infographics.
Business Diagram
Need to showcase complex business processes or organizational hierarchies? Our template includes a business diagram feature that allows you to visually represent these structures, making it easier for your audience to grasp the information being presented.
Graph
Graphs are an essential tool for presenting data in a visually appealing way. Our template includes a graph feature that can be customized to showcase various types of data, including trends, comparisons, and patterns.
Business Chart
Whether you're presenting financial data or analyzing market trends, our business chart feature will help you create visually appealing charts that enhance the overall impact of your presentations and reports.
Infographic Flyer
Looking to create an attention-grabbing flyer for your business or event? Our template can be easily adapted to create visually appealing and informative flyers that will captivate your target audience.
Text Infographic
Want to present textual information in a visually appealing way? Our template allows you to incorporate text elements into your infographic, ensuring that important information is easily accessible and visually engaging.
Process Diagram
When presenting a step-by-step process or workflow, a process diagram is an effective tool. Our template includes a process diagram feature that allows you to break down complex processes into easily understandable visual representations.
Infographic
Our template is designed keeping in mind the principles of effective infographic design. It combines visually appealing elements with clear and concise information to create impactful infographics that draw in your audience.
Data
Data is the backbone of any informative infographic. Our template provides ample space and customization options for incorporating data, allowing you to present it in a visually appealing and comprehensible manner.
Data Report
Creating a data report that is visually appealing and easy to understand can be challenging. Our template eases this task by providing a well-designed layout that highlights your data and ensures clarity and readability.
Information
When presenting information to an audience, it is crucial to ensure that it is presented in a visually engaging manner. Our template allows you to present information in a visually appealing and easily understandable format.
Infographic Template
Our Four Phase Comparison Donut Chart Template is a flexible and customizable infographic template that can be adapted to suit your specific needs. Whether you're creating a presentation, a report, or a brochure, our template will help you create visually appealing and impactful infographics.
Report Template
Creating a professional and visually appealing report can be time-consuming. Our template provides a ready-to-use report layout that can be easily customized to showcase your data and information in a visually engaging manner.
Infographic Diagram
Our template includes a versatile and visually appealing infographic diagram feature. This allows you to present complex information, concepts, and relationships in a simplified and easily understandable way.
Infographic Design
A well-designed infographic is essential for conveying information effectively. Our template incorporates design elements that enhance the visual appeal of your infographics, ensuring that they captivate your audience and make a lasting impact.
Data Infographic
Data-driven infographics are a powerful tool for presenting complex data sets in a visually appealing and easily understandable way. Our template provides the perfect platform for creating impactful data infographics that captivate your audience.
Chart
Charts are invaluable for presenting data and trends. Our template allows you to create visually appealing and informative charts that highlight key data points and make it easier for your audience to interpret the information being presented.
Business Report
Creating a visually appealing and impactful business report is crucial for effectively conveying information. Our template provides a professional and well-designed layout that ensures your business report leaves a lasting impression on your audience.
Report Design
The design of your report plays a significant role in its overall impact. Our template incorporates design elements that enhance the visual appeal of your report, ensuring that it stands out and captures the attention of your audience.
Graph Chart
Graphs and charts are essential for presenting data in a visually engaging way. Our template allows you to create visually appealing graphs and charts that effectively communicate information and make it easier for your audience to understand the data being presented.
File Type: EPS, JPGCategory: Vector Template