You might also like


Financial Timeline and Percentage Chart Template – Free Stock Photo, Download Free
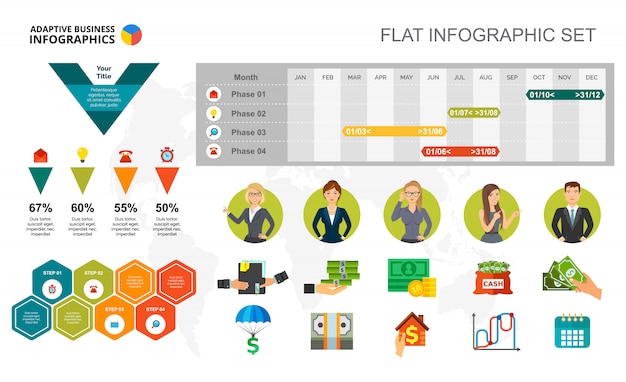
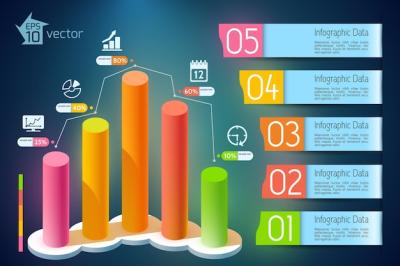
Financial Timeline and Percentage Chart Template
Are you looking for a reliable and visually appealing way to present financial data? Whether you are preparing a report, a presentation, or creating material for your business, our Financial Timeline and Percentage Chart Template is here to help you communicate effectively.
Whatâs Included in the Template?
This template file includes both EPS and JPG formats, making it accessible for various applications. You can easily customize the content to fit your specific needs and brand style.
Key Features of the Template
- Professional Design: Crafted with meticulous attention to detail, this template enhances the visual appeal of your financial presentations.
- Easy to Use: The user-friendly design allows for quick modifications, so you can focus on presenting your data without any hassle.
- Versatile Formats: The EPS format is perfect for scalable designs, while the JPG is ideal for immediate use in various projects.
- Comprehensive Charts: The template includes detailed percentage charts and a clear timeline to depict financial progress over time.
Benefits of Using the Financial Timeline Template
By using our Financial Timeline and Percentage Chart Template, you can:
- Enhance the clarity of your financial information.
- Make your presentations more engaging and easier to understand.
- Save time on design work, allowing you to complete your presentations quickly.
- Ensure your financial data is well-organized and visually striking.
How to Use the Template
Using the template is straightforward. Simply download the file from hdstockimages.com and follow these steps:
- Open the file in your preferred graphic design or presentation software.
- Customize the text and numbers to reflect your financial data.
- Add your branding elements, such as logos or color schemes.
- Save your work and present it confidently!
Who Can Benefit from This Template?
This template is perfect for:
- Business professionals looking to present financial reports.
- Students working on assignments related to finance and economics.
- Marketing teams who need clear visuals for their campaigns.
- Consultants and analysts who require effective communication of data.
The Importance of Visual Representation in Finance
In the world of finance, visuals can make a big difference. They help in understanding complex data and trends with ease. A well-made chart or timeline can transform dull data into something engaging and informative. Our template allows you to achieve this effortlessly.
Conclusion
Donât let your financial data get lost in words. With our Financial Timeline and Percentage Chart Template, you can present your information clearly and effectively. Visit hdstockimages.com today to download your template and take the first step towards impactful presentations.