Data Analysis Graph Illustration – Free Download, Free Stock Photo
Illustration of Data Analysis Graph
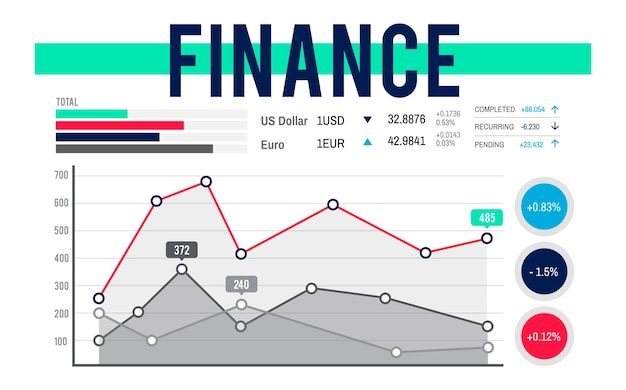
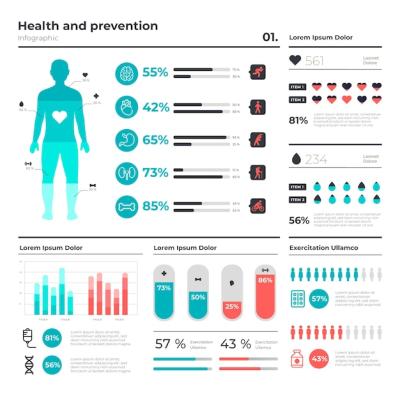
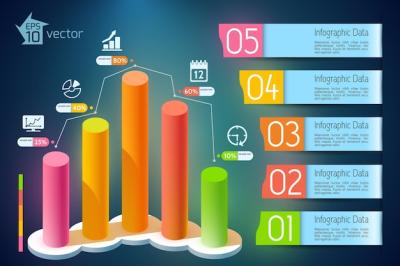
Our Illustration of Data Analysis Graph is a perfect choice for anyone looking to enhance their projects with clear and informative visuals. This vector template offers a professional and modern design that effectively conveys complex data in a simple way.
Key Features
- Available in EPS and JPG formats
- High-quality graphics suitable for print and digital use
- Easily editable to fit your design needs
- Perfect for presentations, reports, and marketing materials
Why Choose This Template?
When it comes to communicating your ideas, visuals play a crucial role. With this illustration, you can make data more engaging and easier to understand. Whether you are a business professional, educator, or designer, this vector template can serve as a valuable asset in your toolkit.
Usage Scenarios
This data analysis graph illustration can be used in various contexts, including:
- Business presentations for data reporting
- Academic projects for showcasing research findings
- Marketing campaigns to display statistics
- Web designs and infographics for content enhancements
How to Edit the File
Editing the EPS or JPG files is straightforward. Here are some steps to get you started:
- Download the file from our website.
- Open the file in your preferred graphic design software.
- Make necessary changes, like adjusting colors or adding text.
- Save your edited version in the desired format.
Conclusion
Enhancing your projects with our Illustration of Data Analysis Graph is an easy step towards better communication and visual storytelling. With its clarity and flexibility, this template is sure to make a lasting impact.
Visit HD Stock Images today to download your copy and start creating visually appealing content that resonates with your audience.
