You might also like


Colorful business infographic with cycle diagram, pie chart, graphs, arrows, and data
Description:
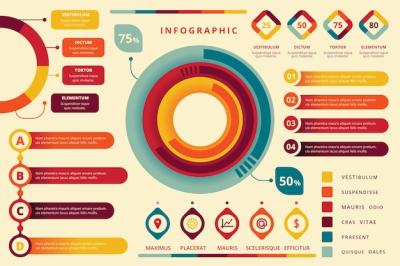
Are you looking for a visually appealing business infographic that represents your data in a clear and concise manner? Look no further! Our Vector Templates file is the perfect solution for you.
Featuring a vibrant and eye-catching isometric design, this infographic is sure to grab the attention of your audience. The colorful cycle diagram, pie charts, and graphs add a touch of creativity to your data visualization, making it easier for viewers to analyze and understand the information.
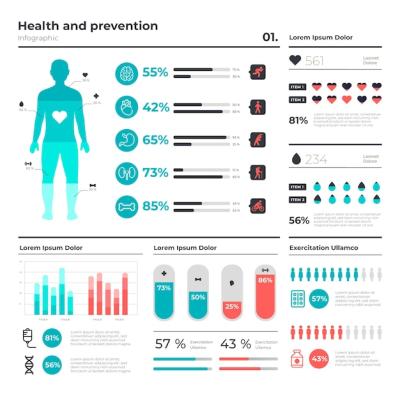
Efficient Data Representation
With our Isometric colorful business infographic, you can showcase various types of data, including percentage charts, statistics, and growth graphs. Whether you need to present financial figures, research data, or business reports, this infographic is versatile enough to suit your needs.
Easy to Customize
We understand that every business has its unique branding and style requirements. That's why our Vector Templates file is easily customizable. You can tailor the colors, fonts, and layout to match your company's visual identity, ensuring a seamless integration of the infographic into your presentations, reports, or website.
Multiple File Formats
To provide maximum flexibility, we offer our Isometric colorful business infographic in two file formats: EPS and JPG. The EPS format allows you to edit the infographic using vector graphics software, ensuring high-quality output. Meanwhile, the JPG format is suitable for quick and easy sharing or embedding on websites or social media platforms.
Wide Range of Applications
Our Vector Templates file is designed to cater to various industries and purposes. Whether you're in finance, marketing, education, or any other field that requires data visualization, this infographic will help you present your information in a compelling and professional manner.
Get Started Today!
Don't miss out on the opportunity to transform your data into visually appealing and engaging content. Visit our website https://hdstockimages.com/ and browse our Vector Templates category to unlock a world of data representation possibilities.
Tags:
- isometric graph
- isometric chart
- graph
- graph chart
- data graph
- percentage chart
- statistics
- data chart
- growth graph
- arrow chart
- pie graph
- isometric infographic
- infographic percentage
- pie charts
- infographic bar
- infographic graph
- finance infographic
- growth chart
- data report
- arrow graph
- pie diagram
- finance report
- report
- chart
- finance graph
- data infographic
- growth infographic
- infographic set
- arrow infographic
- statistics infographic
- infographic chart
- round infographic
- information chart
- abstract infographic
- isometric data