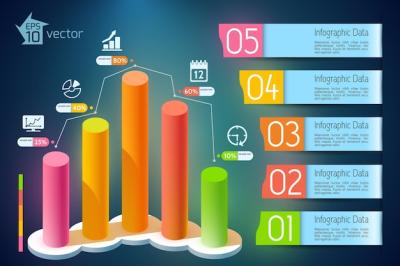
Business Percentage and Line Charts Template for Presentation – Free Download
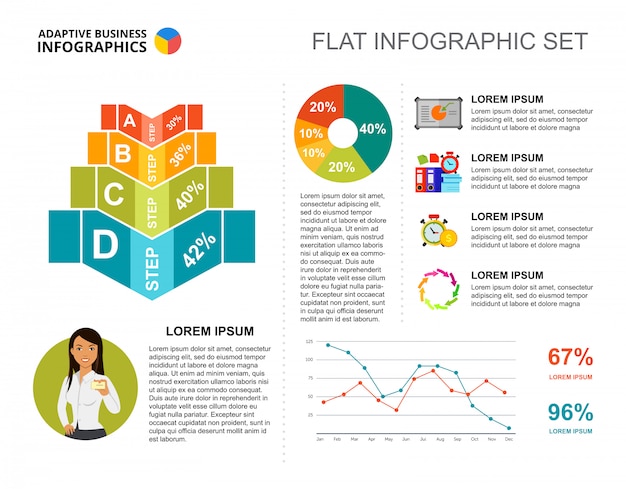
Business Percentage and Line Charts Template for Presentations
Presenting data should be simple and engaging. Our Business Percentage and Line Charts Template is designed to help you showcase your information clearly and effectively. Whether you're preparing for a business meeting, a classroom presentation, or a report, this template makes it easy to convey your message.
Key Features of the Template
- Multiple File Formats: Available in both EPS and JPG formats, allowing you to use the template easily in various software applications.
- User-Friendly Design: The layout is intuitive, making it easy for anyone to create stunning presentations.
- Customizable Elements: Adjust colors, fonts, and styles to match your brand and preferences.
- High Quality: Each element is designed with high-resolution graphics, ensuring a professional appearance.
Why Choose This Template?
Using visuals like percentage and line charts can significantly enhance your presentations. Here are a few reasons why this template can be beneficial:
- Easy Interpretation: Charts help your audience understand trends and data points at a glance.
- Professional Appeal: A well-structured presentation enhances your credibility and keeps your audience engaged.
- Time-Saving: With pre-designed charts, you can save precious time in creating your slides from scratch.
- Versatility: Suitable for various industries and topics, from finance and marketing to education and research.
How to Use the Template
Getting started with our template is straightforward:
- Download: Choose the file format that suits your needs and download the template.
- Edit: Open the file in your preferred graphic design or presentation software.
- Customize: Adjust the charts to fit your data and style preferences.
- Present: Use the completed slides in your presentation to impress your audience.
Conclusion
The Business Percentage and Line Charts Template is a valuable addition to your presentation toolkit. It simplifies the process of presenting data, ensuring your important information stands out. Donât let complex data overwhelm you; find comfort in presenting with clarity and professionalism.
