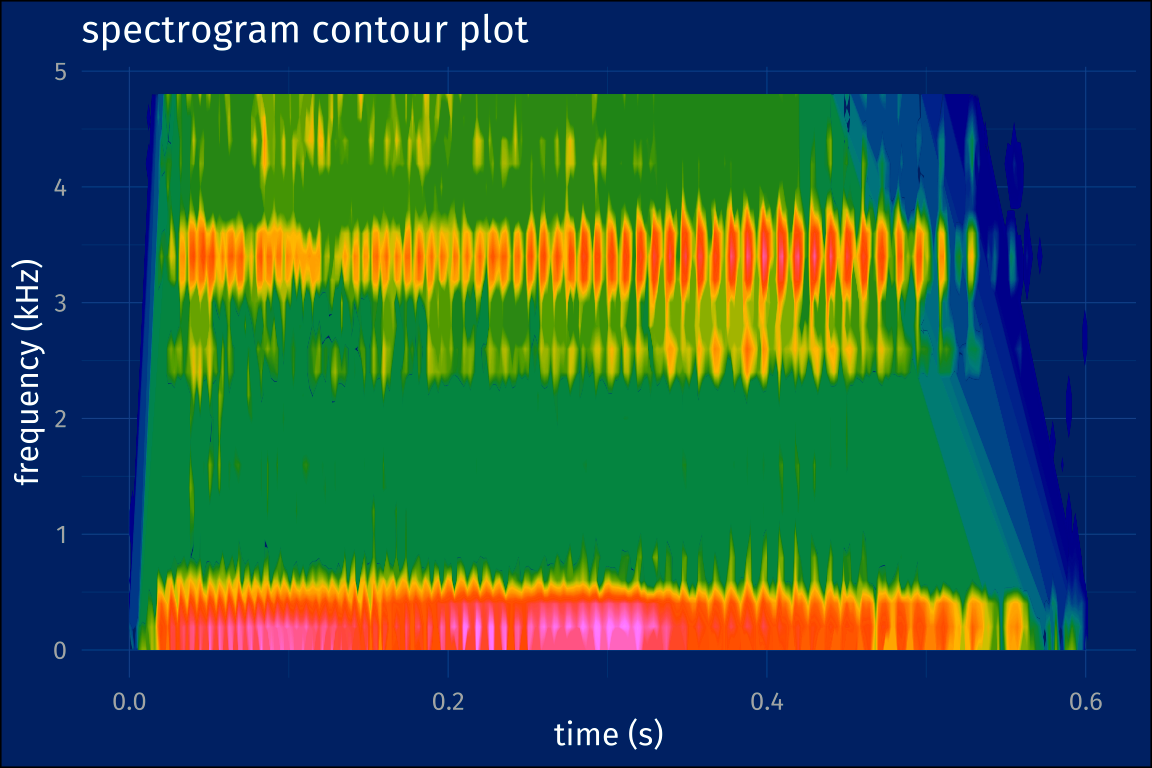
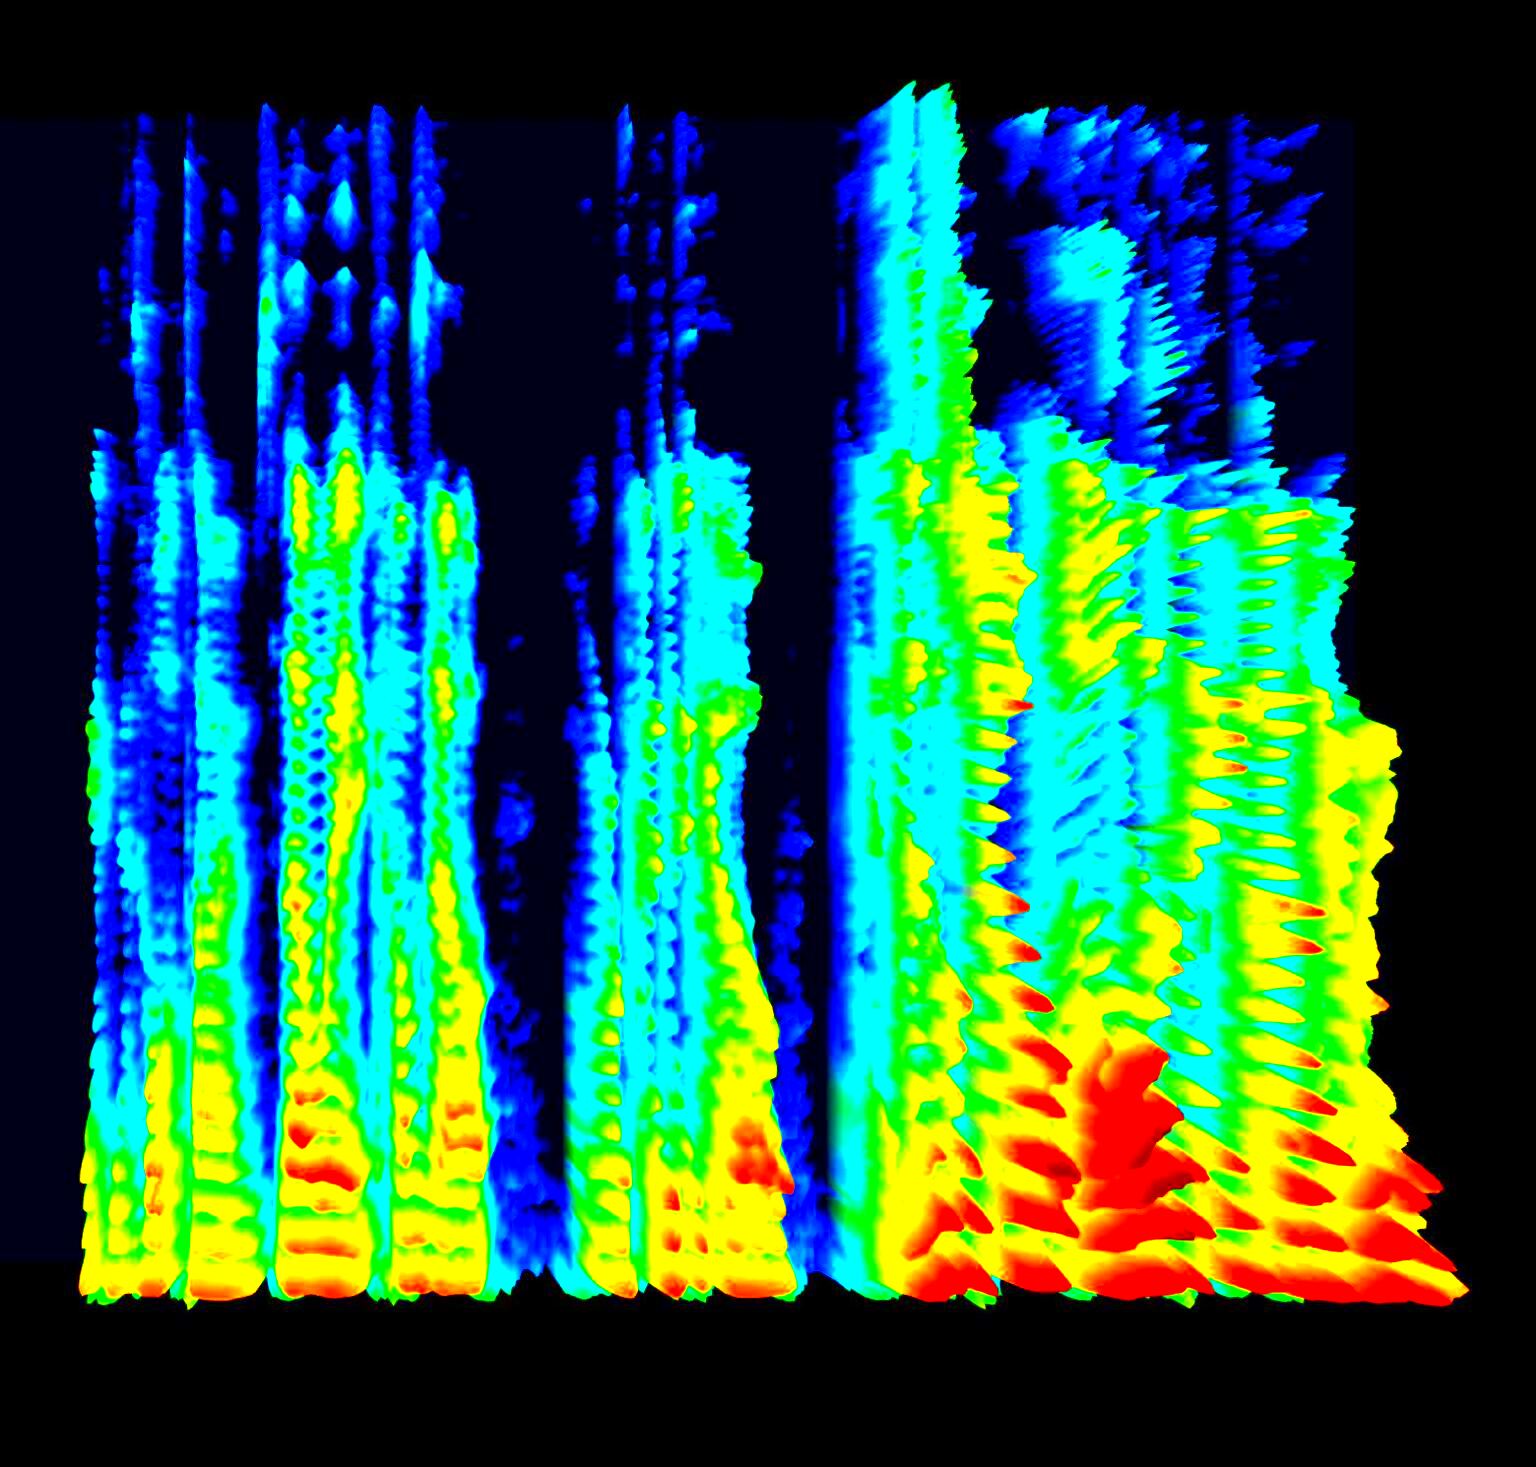
A spectrogram is a visual representation of a sound's frequency spectrum over time, often used in audio analysis. But did you know you can create a spectrogram-like effect from an image? Transforming images into spectrograms can give your visuals a unique, artistic look. This blog will walk you through the process of turning your images into spectrograms, explaining the steps, software tools, and tips along the way. Whether you're a digital artist or someone interested in experimenting with different visual techniques, this transformation can add a creative touch to your work.
Understanding the Concept of a Spectrogram

A spectrogram is typically used to display how sound frequencies evolve over time, with the x-axis representing time, the y-axis representing frequency, and color or brightness showing the amplitude of sound. When applied to images, a spectrogram-like effect can create interesting patterns, making the image appear as though it’s made up of sound waves. This transformation can alter the aesthetic of your image, offering an abstract or experimental appearance.
The traditional spectrogram consists of several elements:
- Time: Represented by the x-axis, showing how the sound evolves.
- Frequency: Represented by the y-axis, showing the range of frequencies in the sound.
- Amplitude: Shown using color or brightness, representing the volume of the sound at different frequencies.
When applied to an image, the idea is to manipulate these elements to form a visually captivating piece that mimics the style of a sound spectrogram.
Also Read This: How to Download iStock Videos Without Watermark: A Comprehensive Guide
Choosing the Right Image for Conversion
Not all images will work well when converted into spectrograms. It's essential to select the right image to achieve the desired effect. Ideally, you want an image that has clear contrasts, defined shapes, or interesting textures. Images with high contrast between light and dark areas will produce better results when transformed into a spectrogram.
Here are some tips to help you choose:
- High Contrast: Images with distinct light and dark areas tend to produce more striking spectrogram effects.
- Simple Backgrounds: Avoid overly complex images with lots of small details, as they might get lost in the transformation.
- Abstract or Geometric Shapes: These work particularly well, as they translate into interesting spectrogram patterns.
- Texture and Patterns: Textured images or those with repeating patterns often result in more engaging spectrogram visuals.
Once you've selected your image, the next step is converting it into a spectrogram, where these elements will be manipulated to create a unique visual result.
Also Read This: Boost Engagement with 123RF Stock Photos
Steps for Making an Image into a Spectrogram
Turning an image into a spectrogram involves several key steps. While the process might sound complicated at first, it’s fairly simple once you break it down. Here's a step-by-step guide to help you transform any chosen image into a stunning spectrogram:
- Step 1: Select the Image – Choose an image with high contrast, textures, or patterns that will look interesting once transformed into a spectrogram (refer to the previous section for tips).
- Step 2: Convert the Image into Grayscale – Since spectrograms work best when displayed in varying shades of gray or color, convert your image to black and white first. This step helps emphasize the contrast and make the transformation clearer.
- Step 3: Use Audio Processing Software – Choose a software or tool that allows you to process images into spectrograms. Many tools designed for audio editing or visual art allow image-to-sound conversion. You'll use this to manipulate the image data.
- Step 4: Apply the Spectrogram Effect – Once your image is processed, apply the spectrogram effect. This usually involves mapping the pixels to audio frequencies and adjusting the brightness based on amplitude.
- Step 5: Fine-Tune Your Result – After the effect is applied, adjust the intensity, contrast, and colors to match your preferences. You can tweak how the spectrogram appears by modifying these elements.
These steps should guide you toward creating a unique and visually compelling spectrogram effect from your image. With a bit of practice, you’ll be able to experiment with different styles and achieve even more creative results.
Also Read This: how to turn image into link
Using Software Tools for Image Conversion
To convert images into spectrograms, you need the right software tools. Fortunately, there are several options available, each with unique features and capabilities. Here are some popular software tools you can use for this task:
- Audacity – This free, open-source audio editing software allows users to apply a spectrogram effect to audio and images. It’s user-friendly and highly popular for beginners.
- Photoshop – While Photoshop doesn’t offer a direct way to create spectrograms, you can manipulate image layers and colors to replicate the effect. Advanced users can use the ‘noise’ or ‘waveform’ filters for similar results.
- Matlab – For those who are comfortable with coding, Matlab offers the ability to use custom scripts to transform images into spectrograms by processing the data in a more detailed manner.
- GIMP – Another free tool, GIMP can be used for image manipulation and, with the right plugins, can help you generate spectrogram-like effects from your images.
These software tools offer a variety of features to help you create stunning spectrogram effects from your images. Whether you’re a beginner or an advanced user, there’s a tool that fits your needs.
Also Read This: Beta Beats: Enabling Beta Features on Spotify – Exploring the Latest Innovations
Adjusting Settings for a Better Spectrogram Effect
Once you’ve applied the spectrogram effect to your image, you may need to adjust several settings to improve the final look. Proper adjustments can make the difference between a bland and a visually striking spectrogram. Here are some key settings to focus on:
- Brightness and Contrast: Increasing contrast and adjusting brightness levels can help enhance the details of the spectrogram, making it appear more vivid. You can experiment with these settings to create stronger or softer visuals, depending on the desired effect.
- Color Palette: Many spectrogram generators allow you to change the color scheme. Try experimenting with different color gradients to see how they alter the aesthetic of the image. Using warm colors like red and orange can create a dramatic effect, while cool colors like blue and green produce a calmer look.
- Frequency Range: The frequency range you choose will impact the way patterns appear in the spectrogram. By adjusting the range, you can focus on specific frequency bands that give you the visual pattern you want. Narrowing the range can create more defined patterns, while a broader range can lead to a more chaotic result.
- Resolution: Higher resolution can make your spectrogram sharper and clearer. However, be mindful of the file size as well, especially if you're working with large images.
Fine-tuning these settings allows you to customize the spectrogram’s appearance to match your vision. With the right adjustments, you can turn a simple image into a complex and visually compelling piece of art.
Also Read This: Using Image Occlusion in Anki
Common Mistakes to Avoid While Creating a Spectrogram
Creating a spectrogram can be a fun and creative process, but it’s easy to make mistakes along the way. Avoiding these common pitfalls can help you achieve the best possible results with minimal frustration. Here are some mistakes to watch out for:
- Choosing the Wrong Image: As mentioned earlier, selecting the right image is crucial. If your image lacks contrast or texture, the resulting spectrogram might look flat and uninteresting. Always pick images with clear contrasts and defined shapes.
- Overcomplicating the Image: Simplicity is often key. Trying to convert overly complex images with a lot of small details can lead to a confusing or muddled spectrogram. Stick to simpler designs or abstract images for the best results.
- Neglecting Resolution: Low-resolution images may result in blurry or pixelated spectrograms. Always ensure your images are high enough in resolution to maintain quality during the transformation process.
- Incorrect Settings Adjustment: Over-adjusting brightness, contrast, or frequency ranges can distort the spectrogram, leading to a less attractive or overly busy final result. Make adjustments incrementally and check your work regularly.
- Skipping the Preview Step: Before finalizing your spectrogram, always preview your work. This step allows you to spot any areas that need improvement or refinement. It’s much easier to fix issues in the preview stage than after you’ve completed the conversion.
By avoiding these common mistakes, you can ensure that your spectrogram turns out just the way you envision it, with clear patterns and visual appeal.
Also Read This: Rental Costs at Image Studios: What to Expect
Frequently Asked Questions
Converting images into spectrograms can be a new and exciting concept for many people. Here are some frequently asked questions to help clear up any confusion and provide more insight into the process:
- What software can I use to create a spectrogram? – There are several options, including Audacity, Photoshop, Matlab, and GIMP. These programs allow you to convert and manipulate images into spectrogram-like visuals, depending on your skill level and needs.
- Can I convert any image into a spectrogram? – While technically any image can be converted, images with high contrast and simple designs tend to yield the best results. Abstract images, geometric shapes, and those with clear textures are particularly effective.
- Do I need any special skills to create a spectrogram? – You don’t need to be a professional to create a spectrogram, but understanding the basics of image editing and spectrogram generation will be helpful. Tutorials and guides can make the process easier to understand.
- Can I adjust the colors in my spectrogram? – Yes, many spectrogram tools allow you to adjust the color palette. Experimenting with different colors can add a personal touch to your work and make the spectrogram visually striking.
- How long does it take to make a spectrogram? – The process can take anywhere from a few minutes to an hour, depending on the complexity of the image and the software you're using. Simpler images will usually be faster to convert than detailed ones.
Conclusion and Final Thoughts
Creating spectrograms from images is a unique way to experiment with visuals and sound. By following the steps outlined in this guide, you can turn any image into a striking visual representation of sound frequencies. While it may take some practice to perfect your technique, the results are well worth the effort. Remember to choose the right image, adjust your settings carefully, and avoid common mistakes along the way. With a bit of creativity, you can produce artwork that is both visually and conceptually intriguing.
We hope this guide has given you a solid understanding of how to create spectrograms from images. Whether you’re working on a personal project or just experimenting for fun, enjoy the process and don’t be afraid to push your creative boundaries!

 admin
admin


