Tableau is a powerful tool for visualizing data, but sometimes you need to add more than just numbers and charts. Loading images in Tableau can enhance your dashboards, making them more interactive and engaging. By showing images based on user interaction—whether they click or hover over an element—your audience can experience a dynamic and visually rich story. In this guide, we’ll walk you through how to integrate images into your Tableau workbooks effectively, making your data come to life with visuals that add context and depth.
Why Use Images in Tableau Visualizations

Incorporating images into your Tableau visualizations can improve your dashboard’s storytelling and make your data more memorable. Here’s why using images is valuable:
- Visual Appeal: Images can make your dashboard more visually engaging, providing a break from all the data-heavy charts and graphs.
- Contextual Information: Sometimes, showing an image alongside data points can help explain the story better than numbers alone. For instance, showing a product image next to sales data offers a clearer picture of what the data represents.
- Improved User Experience: Adding interactive images—whether by click or hover—can make dashboards feel more dynamic and responsive, keeping users engaged.
- Branding and Design: Including logos, brand colors, and product images can help create a consistent and branded experience for users.
Overall, images not only make your Tableau dashboards look better, but they also serve as tools for deeper understanding and interaction, enhancing both the aesthetic and functional qualities of your visualizations.
Also Read This: The Versatility of Stock Images and the Leadership of Imago Images
Setting Up Your Tableau Workbook for Image Integration

Before you can start adding images to your Tableau workbook, there are a few essential steps to prepare. Let’s break it down:
- Choose Your Image Format: Tableau supports image files like PNG, JPEG, and GIF. Make sure your images are in one of these formats before uploading.
- Store Images Properly: Images can be linked from local files or URLs. If you're using online images, ensure they are accessible. Local image storage requires Tableau Server or Tableau Online for sharing with others.
- Prepare Your Data: In your Tableau workbook, you’ll need a field that associates each data point with its corresponding image. This could be a URL or a file path that links to the image you want to show.
Once your images are ready and your data is prepared, you can start integrating images into your views. Here’s a simple process to get started:
- Drag your image field onto the appropriate shelf in Tableau, such as Detail or Shape.
- Use calculated fields to create a dynamic image association based on user input or filters.
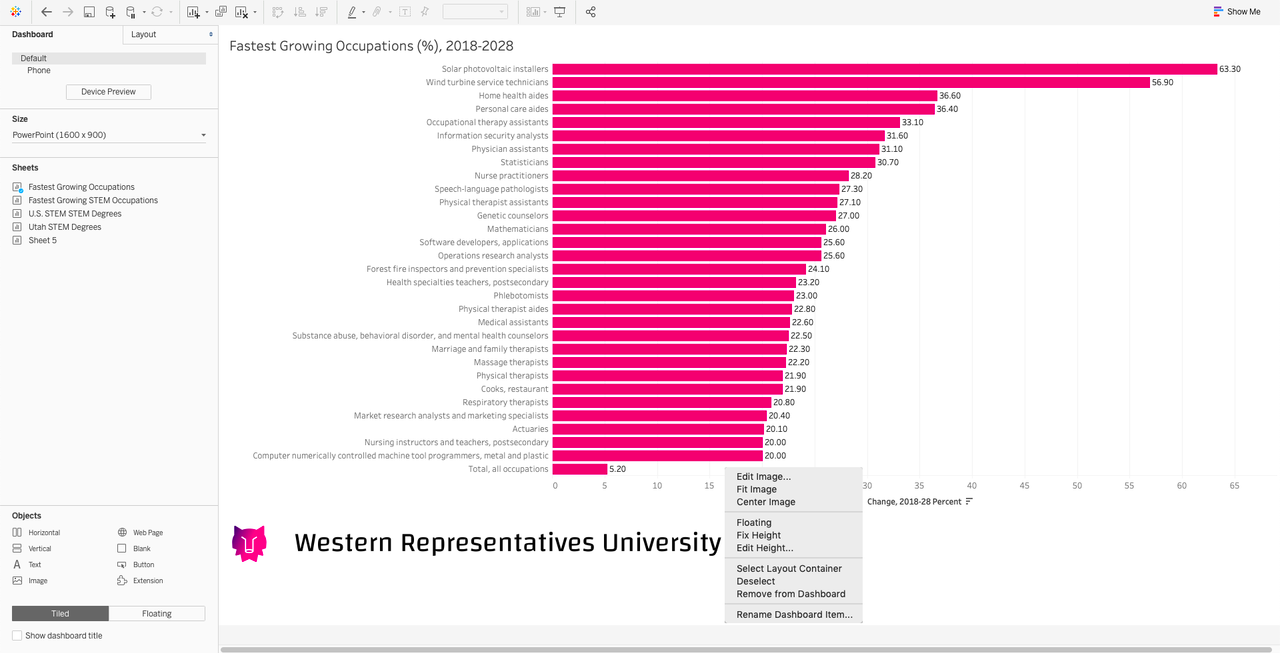
- Adjust the image size and positioning within your Tableau view for better display.
By setting up your workbook correctly, you’ll ensure that your images load seamlessly and display as intended, giving your audience the best possible experience.
Also Read This: Making Money through Adobe Stock or Shutterstock
How to Load Images on Click in Tableau
Loading images on click in Tableau is a powerful way to add interactivity to your dashboards. Instead of showing all images at once, you can set up your workbook to display images only when a user clicks on a specific data point. This feature is especially useful when you want to keep your dashboard clean and only show relevant images when needed.
Here’s how you can set up images to load on click in Tableau:
- Step 1: Prepare your image source. You need a field in your data that links each data point to a specific image URL or file path.
- Step 2: Create a dashboard action. Go to the "Dashboard" menu and choose "Actions". Click on "Add Action" and select "Change Filter" or "Go to URL" based on how you want to load the image.
- Step 3: Configure the action. Set the source sheet (the element you want users to click on) and the target (where the image will appear). For instance, clicking on a bar in a chart could bring up a product image.
- Step 4: Test the interactivity. Click on a data point in your dashboard and confirm that the corresponding image loads properly.
With this method, your dashboard remains clutter-free until the user clicks on an item to reveal more information. It’s a great way to add context to your data without overwhelming your audience with too many images at once.
Also Read This: Is Posting Multiple YouTube Shorts Daily the Key to Growing Your Channel?
How to Load Images on Hover in Tableau
Loading images on hover allows for another level of interactivity in Tableau dashboards. Instead of waiting for a user to click, the image appears when they hover their mouse over a specific data point. This method can provide an instant visual context without requiring any additional clicks.
To set up images that load on hover in Tableau, follow these steps:
- Step 1: Prepare your image field. As with the click method, ensure you have a data field linking your images to the appropriate data points in your workbook.
- Step 2: Use a tooltip to show the image. In Tableau, tooltips are displayed when users hover over a data point. You can customize your tooltip to include an image using an HTML tag that references the image's URL or path.
- Step 3: Format the Tooltip. Go to the Tooltip shelf in your worksheet and insert an HTML image tag like:
<img src='[Your Image Field]'>. - Step 4: Adjust the image size. You may want to scale the image in the tooltip so it fits properly. Use HTML attributes to adjust the width and height of the image.
- Step 5: Test the hover action. Hover your mouse over a data point in the dashboard and check that the image appears correctly in the tooltip.
Hovering to reveal images gives users an interactive experience without needing to click on anything, making it a great option when you want to show additional information in a subtle, non-intrusive way.
Also Read This: 123RF vs Adobe Stock: Comparing Two Prominent Stock Image Providers
Best Practices for Image Placement in Tableau Dashboards
When adding images to your Tableau dashboards, it’s important to do so thoughtfully. Poor placement or overwhelming users with too many images can detract from the clarity and effectiveness of your data visualization. Here are some best practices for placing images in your Tableau dashboards:
- Limit the Number of Images: Too many images can clutter the dashboard and distract from the key insights. Only use images when they add value to the data story you’re telling.
- Ensure Image Quality: Always use high-resolution images that load quickly. Low-quality images can make your dashboard look unprofessional and can slow down performance.
- Optimize Image Size: Don’t make images too large. You want them to enhance the data visualization, not overpower it. Use Tableau’s built-in sizing options to scale the image appropriately.
- Use Tooltips Effectively: Tooltips are a great way to show images without taking up valuable space on the dashboard. Customize tooltips to include images that appear on hover, so your dashboard remains clean while offering detailed visual context.
- Keep Branding Consistent: If you’re using images for branding (like logos or product photos), make sure they are consistent in style and color to match the overall design of your dashboard.
- Ensure Accessibility: Ensure that users with disabilities can also interact with images effectively. Consider adding alt text for images or using accessible design elements that comply with accessibility standards.
By following these best practices, you can make sure your images serve their purpose without disrupting the flow of your Tableau dashboards. A well-placed image can enhance the user experience, provide valuable context, and keep your data presentation looking professional and clear.
Also Read This: Iconic Church Steeples Across the USA Captured in Stunning Photos
Common Issues When Loading Images in Tableau and How to Fix Them
While adding images to your Tableau dashboards is a great way to enhance interactivity and visual appeal, it’s not always smooth sailing. Users often encounter a few common issues when trying to load images. Fortunately, most of these problems can be resolved with a few simple fixes. Let’s walk through some of the typical challenges and how to address them.
- Issue 1: Images Not Showing
One of the most common problems is images not displaying at all. This could be due to several reasons, such as incorrect file paths or unsupported image formats. Ensure that the file path or URL is correct and accessible, and verify that your image is in a format Tableau supports (e.g., PNG, JPEG, GIF). - Issue 2: Slow Image Load Times
If your images are taking too long to load, it could be due to their file size. Large images can slow down dashboard performance, especially if you have multiple images loading simultaneously. To fix this, try optimizing your image files by reducing their size without losing too much quality. Tools like TinyPNG or Photoshop can help with this. - Issue 3: Broken Links or Missing Images
If your images aren’t showing up and you’ve verified the file path is correct, the issue might be with the image’s hosting. For images hosted on external servers, ensure the server is online and accessible. For local images, make sure the file path remains valid and the images are in the correct folder. - Issue 4: Images Appearing Blurry
When images appear pixelated or blurry, it’s often because they’re being stretched beyond their intended size. Be sure to resize your images before uploading them to Tableau to match their intended display size. You can also adjust the image’s size within Tableau to make sure it appears clear and sharp.
By understanding these common issues and their solutions, you can ensure that your images load smoothly and look great on your Tableau dashboards.
Also Read This: Understanding Tom Nash on YouTube His Financial Commentary and Influence
FAQs
When it comes to loading images in Tableau, users often have a few recurring questions. Let’s address some of the most frequently asked questions to help you troubleshoot and understand this feature better.
- Q: What types of images can I use in Tableau?
Tableau supports most standard image formats, including JPEG, PNG, and GIF. However, it’s best to avoid using large, high-resolution images that could slow down your dashboard’s performance. - Q: How can I add an image dynamically to my dashboard?
You can use dashboard actions like "Go to URL" or "Change Filter" to load an image based on user interaction (click or hover). For tooltips, you can insert an HTML image tag linking to the image URL. - Q: Why are my images not showing when I publish the dashboard?
If you’re using local images (stored on your computer), they might not show when published. For shared dashboards, upload your images to a server or Tableau Server so that all users can access them. - Q: How can I make my images load faster?
To speed up image loading times, optimize the size of your images before uploading them. Use online tools like TinyPNG or image editing software to compress images without compromising quality. - Q: Can I display multiple images based on user selection?
Yes, you can use dynamic image actions or calculated fields to display different images based on user interaction with filters or marks in your dashboard.
Conclusion
Adding images to your Tableau dashboards is a powerful way to enrich your visualizations and create a more interactive user experience. By following the steps we’ve discussed, such as loading images on click or hover, and adhering to best practices for image placement, you can create dashboards that are both engaging and informative.
However, it’s important to be aware of common issues that may arise, such as broken links or slow load times, and know how to troubleshoot them. With the right setup and troubleshooting techniques, you can successfully integrate images that add real value to your Tableau dashboards, making them not only more visually appealing but also more insightful for your users.
Now that you have the knowledge to work with images in Tableau, go ahead and experiment with these features to create more dynamic and engaging dashboards!
 admin
admin
