Creating infographics is a fantastic way to communicate complex information in a visually engaging manner. With their combination of graphics and text, infographics can simplify data, making it more accessible and enjoyable for the audience. In this guide, we're diving into the essentials of designing infographics using VectorStock, a fantastic resource for high-quality vector images and graphics. Let's explore what makes infographic design so powerful and how VectorStock can elevate your designs!
Understanding VectorStock and Its Features
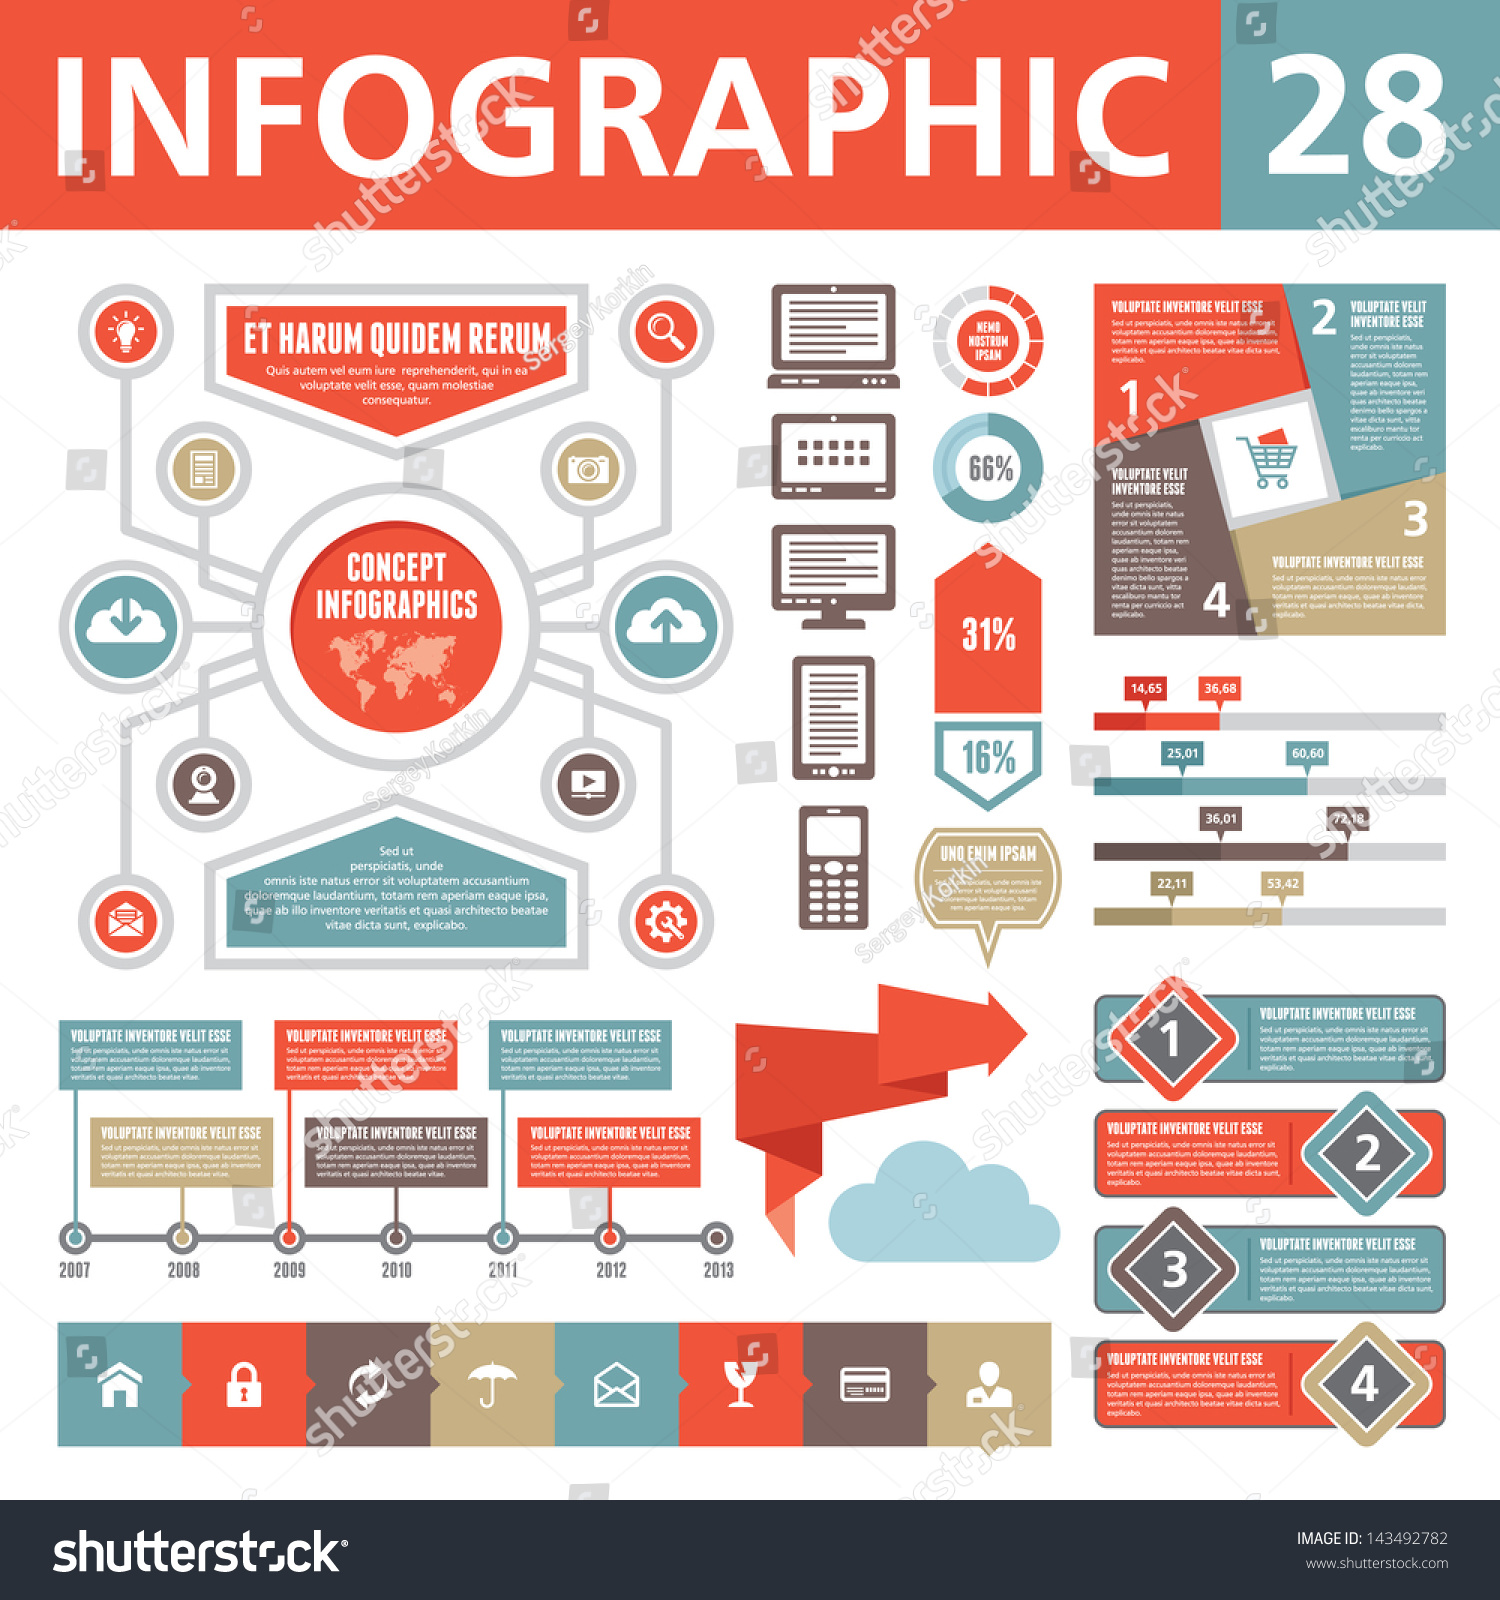
VectorStock is an online marketplace renowned for its vast collection of vector graphics, perfect for creating stunning infographics. Whether you're a seasoned designer or just starting out, VectorStock offers a range of features that can streamline your design process.
Here are some key features of VectorStock:
- Extensive Library: With millions of vector images available, you can find almost anything to support your design needs. From icons and illustrations to patterns and backgrounds, the variety is extensive.
- High-Quality Images: All vectors on VectorStock are professionally crafted, ensuring that you have access to high-quality graphics that look great at any size.
- User-Friendly Search: The search feature allows you to filter results by orientation, style, and even color, making it easier to find exactly what you need for your infographic.
- Customizable Vectors: Since these are vector images, you can easily resize, edit, and customize them using design software like Adobe Illustrator or CorelDRAW without losing quality.
- Affordable Pricing: VectorStock offers competitive pricing options, including pay-as-you-go downloads and subscription plans that can fit any budget, making it accessible for individuals and small businesses alike.
Furthermore, VectorStock's platform is built with users in mind. Here's what you can expect:
- Easy Licensing: The licensing options are straightforward, allowing you to focus on creativity rather than legal complications.
- Frequent Updates: The library is continually updated with new and trending designs, ensuring you always have fresh content to work with.
- Community and Inspiration: VectorStock also connects designers through user galleries, where you can showcase your work and find inspiration from others.
Ultimately, understanding how to leverage VectorStock's features can significantly enhance your infographic design process. It's more than just a repository of images; it's a comprehensive tool that can help you visualize ideas, communicate messages, and engage your audience effectively.
Also Read This: Is It Possible to Access VectorStock for Free? Exploring Free Options
3. Step 1: Define Your Infographic Objective

Before you dive headfirst into designing your infographic, it’s crucial to take a step back and define your objective. Ask yourself: What message do I want to convey? Who is my target audience? Answering these questions will not only clarify your purpose but also guide you throughout the design process.
Here are some tips to help you pinpoint your infographic objective:
- Identify Your Audience: Think about who will be looking at your infographic. Are they industry professionals, students, or a general audience? Understanding your audience’s needs will help tailor your message.
- Set a Clear Goal: What do you want your audience to learn or do after viewing your infographic? Whether it’s raising awareness, presenting information, or encouraging action, having a clear goal will shape the content you include.
- Focus on a Single Message: Keep your infographic centered around one main idea. Trying to pack too much information can overwhelm viewers; instead, aim for clarity and cohesion!
- Choose the Right Format: Depending on your objective, decide what type of infographic would best convey your message. Possible options include statistical, informational, timeline, or process infographics.
Once you’ve determined your objective, jot it down as a concise statement. This will serve as your anchor, reminding you of your purpose throughout the design process. With your objective in hand, you can move on to the next step: researching and gathering your data.
Also Read This: Customizing Vector Graphics from VectorStock for Your Unique Projects
4. Step 2: Research and Gather Your Data
Now that you’ve defined your objective, it’s time to research and gather data. Quality data is the backbone of any effective infographic. Without it, your design is just eye candy. So, where do you start?
Follow these steps to ensure you’re equipped with accurate and relevant data:
- Use Reliable Sources: Aim for data from reputable sources. This could be academic articles, government publications, industry reports, or established organizations. The credibility of your sources directly affects the trustworthiness of your infographic.
- Look for Trends and Patterns: Analyze existing data to uncover trends, patterns, or correlations that align with your objective. This often reveals insights that your audience will find valuable.
- Utilize Statistics Wisely: If your objective involves statistical data, make sure you highlight the most compelling statistics. Use charts or graphs to visually represent these numbers for greater impact.
- Gather Quotes and Testimonials: Incorporating quotes from industry leaders or testimonials can add an element of authority and personalization to your infographic.
- Organize Your Findings: Create a document to compile all your data and information. Group similar ideas together and identify key points that align with your infographic’s objective.
Once you have gathered your data, double-check it for accuracy. Misleading or erroneous information can damage your credibility and the effectiveness of your infographic. Consider using tools like spreadsheets to organize data and visualize how it might fit into your design.
With your objective firmly established and your data collected, you're ready to conceptualize your design. Stay tuned for the next steps, where we’ll discuss how to create a compelling layout and visual elements that captivate your audience!
Also Read This: Transforming Your Brand Identity with Unique Vectors from VectorStock
5. Step 3: Choosing the Right Template on VectorStock
Now that you've got a clear idea of your infographic's purpose, it's time to dive into the world of templates on VectorStock. Choosing the right template is absolutely essential. Think of your template as the canvas for your masterpiece; it sets the stage for your information to shine.
To start, go to the VectorStock homepage and navigate to the infographics section. Here are a few tips to help you pick the right template:
- Match Your Theme: Look for templates that align closely with your theme. For example, if you're crafting a health-related infographic, choose a template that features medical icons or calming colors.
- Consider Layout: Think about how you want to present your information. Do you prefer a chronological layout, a process flow, or perhaps a comparison? VectorStock offers a variety of layouts, so select one that suits your content structure.
- Be Mindful of Space: Ensure the template has enough space for your information without looking cluttered. You want your audience to absorb the information easily, so choose a template that gives you room to breathe.
- Visual Hierarchy: Look for templates that guide the viewer's eye. Effective infographics often have a clear hierarchy, with headlines, subheadings, and body text that flow well.
- Customization Potential: Choose a template that you can customize easily. Some templates might look great, but they may not allow for the modifications you need. Make sure you can adjust colors, fonts, and layouts as necessary.
Once you’ve found a few templates that catch your eye, it's a good idea to save them to your favorites. This way, you can easily compare and choose the best one when you’re ready to start designing.
Also Read This: Exploring Atrial Fibrillation Illustrations on VectorStock: What’s Available
6. Step 4: Customizing Your Infographic Design
You've selected your template—great! Now, it’s time to roll up your sleeves and start customizing your infographic design to make it uniquely yours. Customization is where your creativity can truly shine, and it allows you to convey your message in a way that's authentic to your brand.
Here’s a step-by-step guide to help you with this crucial phase:
- Color Palette: Start by selecting a color palette that reflects your brand or the mood you want to convey. Websites like Coolors can help you create beautiful color schemes. Remember, consistency is key—stick to a limited palette for a professional look.
- Fonts and Typography: Choose fonts that match the tone of your infographic. For instance, a tech-themed infographic may work well with modern sans-serif fonts, while an artisan-focused piece might benefit from more decorative serif fonts. Ensure readability is your priority!
- Icons and Graphics: VectorStock has a vast library of icons and graphics that you can integrate into your design. Use these to illustrate points, making your information more digestible. Just don’t go overboard—too many visuals can distract from your message.
- Data Visualization: If your infographic includes charts or graphs, simplify the data as much as possible. Choose visualization types (bar charts, pie charts, etc.) that best suit the data you're presenting. Tools like Canva can sometimes help you create custom visuals for your data.
- Layout Adjustments: Don’t hesitate to tweak the layout! Move elements around until you're happy with the flow. Each section should lead smoothly into the next, making it easy for viewers to follow along.
Lastly, once your customization is complete, take a moment to review everything. A fresh set of eyes can help you notice things you may have missed—typos, inconsistent spacing, or visuals that don’t quite fit. After making the final adjustments, you're ready to roll out your fantastic infographic!
Also Read This: Why VectorStock Is a Go-To for Back-to-School Graphics and Posters
7. Step 5: Incorporating Visual Elements and Icons
Once you've cemented your infographic's layout and structure, it’s time to think about the visual elements that will truly make your design pop! Incorporating visuals like icons, illustrations, and charts can elevate your infographic from good to great. Here’s how you can do it effectively:
- Choose Your Icons Wisely: Icons should complement the content and not distract from it. You can explore VectorStock's vast library of customizable icons. Look for icons that resonate with your topic. For instance, if your infographic is about health, consider using medical-themed icons.
- Maintain a Consistent Style: All visuals should have a cohesive style. This could mean sticking to a particular color palette or choosing icons that share the same artistic flair. Consistency in style fosters a seamless flow throughout your design.
- Use Visual Hierarchy: Not every element needs to stand out. Use size, color, and placement to create a hierarchy, guiding the viewer's eye to the most important parts of your infographic. Larger icons can signify importance while smaller icons may support subordinate information.
- Incorporate Charts and Graphs: Simplifying complex data into easy-to-understand charts and graphs can significantly enhance comprehension. VectorStock offers a variety of chart templates that you can tweak to fit your design.
- Keep It Balanced: When adding visuals, be mindful of white space. A cluttered infographic can overwhelm readers and confuse them. Balance is key to making sure each element has room to breathe.
As you incorporate these visual elements, remember that their primary purpose is to engage and inform your audience. Ensure they serve a function and contribute to the overall story your infographic is telling.
Also Read This: Top Ways to Use VectorStock Graphics in Advertising Campaigns
8. Step 6: Designing for Clarity and Engagement
Designing an infographic is not just about aesthetics; clarity and engagement should be at the forefront of your mind. After all, the ultimate goal is to communicate your message effectively. Here are some strategies to ensure your designs are clear and captivating:
- Keep Text Short and Sweet: In infographics, less is often more. Use concise language and bullet points to convey information quickly. Aim for simplicity—this allows your audience to grasp the key messages without drowning in text.
- Choose Readable Fonts: Typography plays an important role in readability. Select fonts that are clear and easy to read from a distance. Use varying font sizes to establish a hierarchy, making titles larger than body text.
- Use Color Meaningfully: Color can evoke emotions and emphasize certain aspects of your design. Stick to a limited color palette that aligns with your brand while also making sure the colors contrast well to enhance readability.
- Test Your Layout and Flow: Don’t be afraid to seek feedback. Share your draft with others to get their perspective on clarity. Do they understand the major points quickly? This input can help you spot areas that might be confusing.
- Engagement Elements: Make your infographic interactive by integrating elements like QR codes or links to additional resources. This can be a great way to encourage viewers to take the next step, whether it’s sharing your infographic or delving deeper into a topic.
In your quest for clarity and engagement, always remember your audience. Think about what information they need and how they prefer to consume it. With this in mind, you’re not just creating a graphical representation of data—you’re crafting a visually compelling narrative that invites engagement and delivers insights.
Also Read This: Can You Use VectorStock Graphics for Print-on-Demand Projects?
9. Step 7: Finalizing and Exporting Your Infographic
Alright, you’ve created an amazing infographic using VectorStock, and now it’s time to put the final touches on your masterpiece. Finalizing is a crucial step that ensures everything is polished and professional before you share it with the world. Let's break down this process to ensure you don’t miss anything important.
First off, do a thorough proofread of your content. Check for any spelling or grammatical errors. Remember, small mistakes can detract from your credibility. Once you've read through it a couple of times, consider having someone else take a look. A fresh pair of eyes can catch errors you might have missed!
Next, make sure your design elements are aligned properly. Use the alignment tools in VectorStock to snap your text and graphics into place. A well-organized layout not only looks professional but also makes it easier for your audience to absorb the information. Here are a few alignment tips:
- Consistency: Ensure all your text sizes and font styles are consistent.
- Spacing: Pay attention to the spacing between different elements – adequate whitespace can enhance readability.
- Color balance: Ensure that the colors you’ve chosen are harmonious and that text contrast is strong enough for legibility.
Once you’re happy with the visuals, it’s time to export your infographic! VectorStock offers several format options. Generally speaking, the most common formats are:
| Format | Best Use |
|---|---|
| PNG | Ideal for web use or social media, excellent for detailed images. |
| JPG | Great for high-quality images where file size is important, but it can lose some quality. |
| Best for printing or sharing as a document, retains high quality. |
After selecting your preferred format, make sure to adjust the resolution according to where you plan to publish it. A resolution of 72 DPI (dots per inch) is typically sufficient for online use, while 300 DPI is ideal for print.
Finally, create a backup of your design file in its original format. This way, if you need to make edits in the future, you have easy access to the original design files without starting from scratch.
Also Read This: Is VectorStock Reputable? What You Need to Know Before Signing Up
10. Tips for Promoting Your Infographic Online
Now that your infographic is looking sharp, it’s time to get it out there! Promotion is key to ensuring your hard work pays off. Here are some effective strategies to help spread the word about your infographic:
- Leverage Social Media: Share your infographic across various social media platforms like Facebook, Twitter, LinkedIn, and Instagram. Tailor your posts to suit each platform’s audience.
- Use Hashtags: Utilize relevant hashtags to increase visibility. Research trending hashtags in your niche and include them in your posts.
- Reach Out to Bloggers and Influencers: Contact bloggers or social media influencers who may be interested in your topic. They might share your infographic with their audience!
- Submit to Infographic Directories: There are several sites dedicated to showcasing infographics, such as Visual.ly or Infographic Journal. Submit yours to gain more exposure.
- Create a Blog Post: Write a complementary blog post discussing the findings in your infographic. Include the infographic within the post and optimize it for search engines to drive organic traffic.
- Email Marketing: Send out your infographic in your newsletter or to your email list. This is a great way to engage your current audience.
Lastly, don’t forget to analyze the performance of your infographic once it’s out there. Use tools like Google Analytics to track views and engagement metrics. This will help you understand what works and refine your future promotional efforts.
In conclusion, creating and promoting an infographic involves attention to detail and strategic execution. By following these steps and tips, you'll be well on your way to crafting an eye-catching infographic and ensuring it reaches the audience it deserves!
Conclusion: Making the Most of Your Infographic Design Skills
As you embark on your journey to master the art of infographic design using VectorStock, it’s essential to keep the following points in mind to maximize your skills:
- Understand Your Audience: Always consider who your infographics are for. Tailoring your designs to your audience's preferences will make your visuals more effective.
- Keep It Simple: Embrace simplicity. A cluttered design can overwhelm viewers, so focus on clear and concise messaging.
- Use Quality Resources: VectorStock offers a plethora of high-quality vector graphics. Choose elements that enhance your message and maintain aesthetic consistency.
- Leverage Color and Typography: Select a harmonious color palette and readable fonts to create a cohesive look. Consistency in these areas strengthens your design.
- Incorporate Data Wisely: Use data visualizations like charts and graphs that clearly present your information without confusion.
Remember to seek feedback from peers and continually refine your skills through practice and study of successful designs. Analyzing what works in other infographics can inspire your creativity and help you develop your unique style.
By applying these strategies and utilizing the resources available on VectorStock, you can enhance your infographic designs, making them not only visually appealing but also informative and impactful.
 admin
admin