Welcome to the beginner's guide to creating tables in Excel 2007! If you're new to Excel or looking to enhance your data management skills, understanding tables is a great starting point. Tables in Excel are particularly useful because they help organize and analyze information efficiently. They can transform a simple dataset into a dynamic and visually appealing presentation that’s easy to navigate and manipulate. Let’s dive in and explore what you need to know about using tables in Excel 2007!
Benefits of Using Tables in Excel 2007
Using tables in Excel 2007 comes with a wealth of benefits that can make your experience smoother and more productive. Here’s a breakdown of some of the most significant advantages:
- Automatic Formatting: When you create a table, Excel automatically applies a professional-looking format. You get alternating row colors, bold headers, and other features that enhance readability without any extra effort on your part.
- Dynamic Range: One of the standout features of Excel tables is that they expand automatically as you add new data. This means you don’t have to manually adjust ranges for formulas or charts; Excel does it for you!
- Filtering and Sorting: Tables come with built-in filtering and sorting options. This allows you to easily find specific information or organize your data based on varying criteria without having to dive into complicated menus.
- Structured References: When working with tables, you can use structured references in your formulas, making it easier to create and manage calculations. Instead of standard cell references (like A1, B2), you can refer to columns by name, which is much more intuitive.
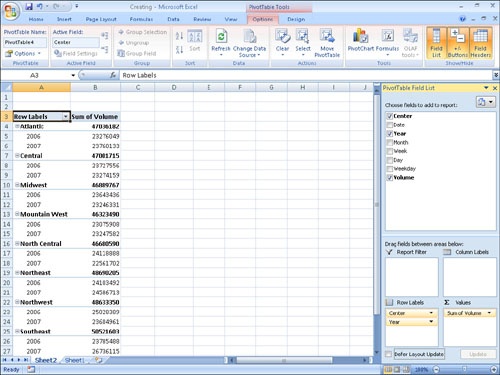
- Data Tools Integration: Tables integrate seamlessly with other Excel data tools, such as pivot tables and charts. This means you can analyze your data in much more powerful ways—all starting from your initial table.
- Easy Collaboration: If you share your Excel file with others, tables can make it easier for collaborators to understand and engage with the data. The clear structure and formatting mean that everyone can quickly find what they need.
In summary, the advantages of using tables in Excel 2007 extend far beyond mere aesthetics. They enhance data organization, make analysis more manageable, and improve overall efficiency—all of which are crucial whether you’re handling personal budgets or complex project data. So whether you're just getting started or looking to sharpen your skills, embracing tables can significantly enhance your Excel experience!
Also Read This: Complete Guide to Playing 8 Ball Pool on Facebook with Dailymotion Videos
3. Step-by-Step Guide to Creating Your First Table
Creating a table in Excel 2007 is a straightforward process, and once you get the hang of it, you'll find it incredibly useful for organizing and analyzing your data. Let's walk through the step-by-step process to create your very first table!
- Open Excel 2007: Launch the application and open a new or existing worksheet where you want to create your table.
- Enter Your Data: Before you can create a table, you need some data. This can be anything from sales figures to a list of your favorite movies. Make sure to arrange your data in a structured way – each column should have a title.
- Select Your Data: Click and drag to highlight all the cells that contain your data, including the headers. For instance, if you have a list of names and ages, highlight that entire range.
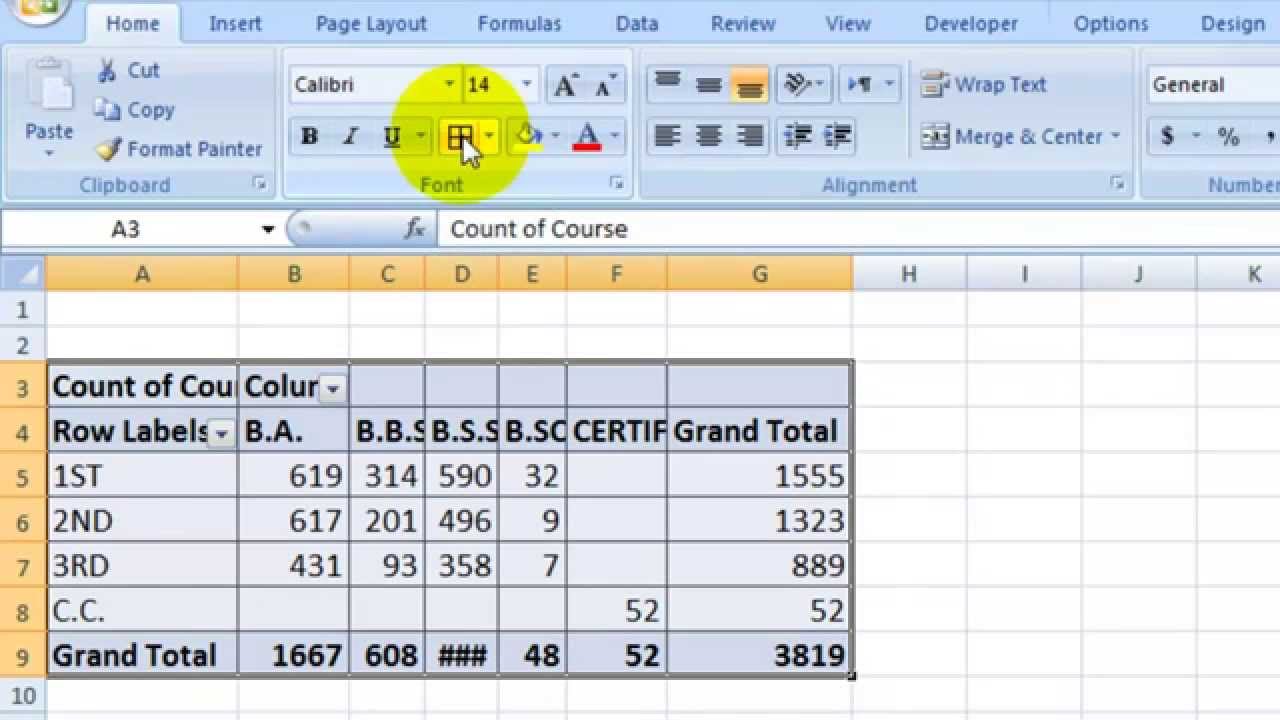
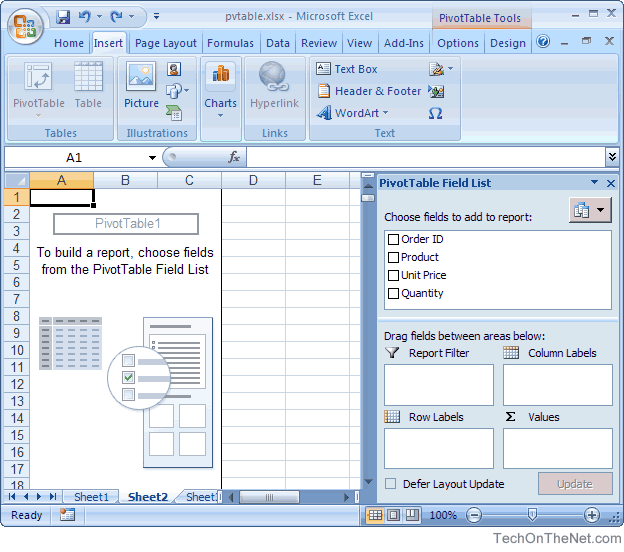
- Insert the Table: Now that your data is selected, navigate to the Insert tab in the Ribbon at the top of Excel. Look for the Table button. Click it!
- Confirm the Table Range: A dialog box will pop up, asking you to confirm the range of your table. Ensure it shows the correct data range. Also, make sure to check the box that says My table has headers if your data includes headers.
- Click OK: Once you're satisfied with your selection and the settings, hit the OK button, and voilà! Your table will be created right in your worksheet.
That’s it! You’ve just created your first table in Excel 2007. Now your data is not only organized, but it is also easier to read and manage. Tables allow for filtering, sorting, and applying styles, which makes your data analysis much more convenient.
Also Read This: Is Dailymotion Safe According to Norton Insights into Its Security
4. Customizing Your Excel 2007 Table
Now that you have your table set up, it’s time to customize it to make it truly yours! Excel 2007 offers a variety of options to help you style and format your table. Let’s look at some of the ways you can customize your table:
- Table Styles: With your table selected, head over to the Table Tools Design tab that appears in the Ribbon. Here you’ll find a gallery of Table Styles. Experiment with different styles to see which one fits your preferences. You can hover over each style to get a preview.
- Adding Total Rows: If you want to quickly summarize data, you can add a Total Row by checking the box for Total Row in the Design tab. This row allows you to perform calculations, like sums or averages, right within your table.
- Filtering and Sorting: One of the most powerful features of tables is the ability to filter and sort your data. Each column header has a dropdown arrow. Click it to see options for sorting your data or filtering to show specific values.
- Changing Table Size: You can adjust your table size easily. Just click and drag the lower right corner of the table to add or remove rows and columns as needed.
- Adding Columns or Rows: If you want to insert more data, simply right-click on the row or column next to your table where you want to add it, and select Insert to create new entries that automatically integrate into your table.
Customizing your table not only makes it visually appealing but also enhances its functionality. Whether you're preparing data for a presentation or just organizing information for personal use, these customization options will help you create a table that stands out!
Also Read This: How Creative Videos Like ‘A Foolish Stag’ Teach Life Lessons on Dailymotion
5. Sorting and Filtering Data in an Excel Table
Once you've created a table in Excel, one of the most powerful features at your fingertips is the ability to sort and filter your data. This makes it easy to analyze information, find trends, and make informed decisions. Let’s break down how to effectively sort and filter your data in Excel 2007.
Sorting your data is straightforward. Excel allows you to sort by any of the columns in your table, whether you’re interested in alphabetical order, numerical order, or even by date. Here’s how you can do it:
- Select any cell within the column you want to sort.
- Go to the Data tab on the Excel ribbon.
- Click on either Sort Ascending (A to Z) or Sort Descending (Z to A).
That’s it! Your data will now be sorted according to your selection. It’s as easy as that, and you can sort multiple columns as well if your table is more complicated. Just remember that sorting will rearrange the data in your table, but it keeps all rows together, so you won’t lose track of any information.
Filtering provides an even deeper level of data analysis. With filtering, you can display only the rows that meet certain criteria, which is incredibly handy if you're dealing with large amounts of data. Here’s how to apply a filter in Excel 2007:
- Click any cell in your table to activate the table tools.
- On the Data tab, click on Filter to enable filtering options.
- Each column header will now show a drop-down arrow. Click the arrow for the column you wish to filter.
- You’ll see a list of all the unique values in that column. You can select or deselect values to show or hide specific rows.
With just a few clicks, you can switch between different criteria, making it easy to find exactly what you’re looking for. Plus, you can clear filters anytime to return to your original data view.
Sorting and filtering within an Excel table not only helps keep your data organized but also enhances your ability to glean insights from it. It’s a perfect pair of tools for any beginner looking to get the most out of their spreadsheet experience!
Also Read This: How to Watch Videos Offline on Dailymotion Enjoy Videos Without Internet
6. Using Formulas with Excel Tables
Formulas are essential for anyone who wants to perform calculations in Excel, and when you’re working with tables, they become even more powerful. Let’s dive into how you can effectively use formulas within your Excel 2007 tables.
When you create a table, Excel provides a structured format that makes your formulas easier to manage and understand. You don’t have to reference specific cell addresses; instead, you can use structured references. This means you refer to table columns by names instead of by A1, B2, etc.
Here’s a quick guide on how to use formulas:
- Click on the cell where you want to enter your formula.
- Start typing your formula with an = sign.
- As you type, Excel will suggest column names on your table. For example, if you have a table named SalesData and a column named Sales, you can write =SUM(SalesData[Sales]) to sum all sales values.
This method helps avoid mistakes and enhances readability. If your table grows or shrinks, Excel automatically adjusts the ranges for you. How handy is that?
Additionally, you can also use functions like AVERAGE, COUNT, and IF with structured references in the same way. Here’s a simple example:
| Formula | Description |
|---|---|
| =AVERAGE(SalesData[Sales]) | Calculates the average of the sales in the Sales column. |
| =COUNT(SalesData[Sales]) | Counts the number of entries in the Sales column. |
| =IF(SalesData[Sales]>1000, "High", "Low") | Checks if sales are greater than 1000; returns "High" or "Low". |
Using these formulas will allow you to analyze your data more effectively and make calculations right within your tables without having to worry about the specific cell references.
In summary, mastering formulas alongside sorting and filtering is essential for efficient data management in Excel. With practice, these skills will become second nature, and your ability to work with data will significantly improve!
Also Read This: The Ultimate Guide on How to Convert Dailymotion Videos to MP4 Format
7. Best Practices for Managing Excel Tables
Managing Excel tables effectively can make a significant difference in your productivity and the quality of your data analysis. Here’s a list of best practices to keep in mind to ensure your tables are organized, functional, and easy to understand:
- Consistent Formatting: Use consistent formatting for headers, data types, and colors. This not only enhances readability but also helps in quickly identifying different sections of your table.
- Descriptive Table Names: When you create a table, give it a descriptive name instead of the default "Table1." This makes it easier to reference the table in formulas and macros.
- Filter Use: Make sure to apply filters to your tables. This allows you to quickly sort and analyze specific data, especially if you’re working with large datasets.
- Regular Updates: Keep your table data up to date. Regularly review and clean your data to ensure accuracy. If certain data points are no longer relevant, consider removing unnecessary columns or rows.
- Use the Table Style Options: Excel provides various built-in table styles. Using these can greatly enhance the aesthetics of your table, making it more visually appealing and easier to understand.
- Document Your Data: If your table contains complex data, consider adding comments or a separate documentation sheet explaining the purpose of certain columns or any calculations made.
- Utilize Named Ranges: If you frequently reference specific ranges in your tables, using named ranges can simplify your formulas and make them more understandable at a glance.
- Backup Your Work: Regularly save your Excel files and consider using version control. Keeping backups can prevent data loss in case of accidental deletions or file corruption.
By following these best practices, you’ll ensure that your Excel tables remain high-quality and effective tools for your data management needs. Whether you’re managing personal finances or handling sales reports, a well-maintained table can save you time and improve accuracy.
Also Read This: Guide to Downloading Dailymotion Videos Using Reddit
8. Troubleshooting Common Issues with Excel Tables
Even the best of us encounter issues when working with Excel tables. Here’s a rundown of common problems you might face and how to troubleshoot them easily:
- Data Not Formatting as Expected: If your table data isn’t displaying correctly, check to see if the data type is set appropriately (e.g., text, number, date). You can adjust the formatting by selecting the cells and choosing the correct format from the “Number” section in the “Home” tab.
- Table Formulas Not Updating: If your formulas are not updating as expected, ensure that you’re using structured references correctly. If you’ve copied a formula from outside the table, it may not recognize that data properly.
- Sorting Issues: Sometimes, after sorting, you may find rows or values don’t match as intended. This often happens when not all columns are included in the sorting operation. Always ensure to select the entire table when sorting.
- Filters Not Working: If your filters aren’t functioning, it might be due to hidden rows affecting the filter. Clear any previous filters, and reapply them to see if that resolves the issue.
- Table Size Limitations: Excel tables can only accommodate a certain number of rows (over a million). If you hit a limit, consider splitting your data across multiple tables or sheets.
- Table Not Expanding Automatically: If your table doesn’t expand automatically when adding new data, make sure the “My table has headers” checkbox is selected under the “Table Tools Design” tab.
- File Format Issues: If you’re having trouble opening a file with tables, ensure you are using a compatible Excel file format (like .xlsx) that supports Excel tables.
Remember, most issues have straightforward solutions. Taking the time to troubleshoot not only resolves the immediate problem but also helps deepen your understanding of Excel’s capabilities!
Conclusion and Additional Resources
Creating a table in Excel 2007 is a straightforward process that can significantly enhance your data management and analysis capabilities. By utilizing tables, not only can you organize your data more effectively, but you also gain access to powerful features such as sorting, filtering, and easy formatting. As you practice and become familiar with the various functionalities, you will discover how tables can streamline your workflow and improve the clarity of your presentations.
To further enhance your Excel skills, consider exploring the following additional resources:
- Microsoft Excel 2007 Help: Access the built-in help feature in Excel for detailed guidance.
- Online Tutorials: Websites like GCFGlobal provide free lessons tailored to beginners.
- YouTube Channels: Channels such as ExcelIsFun offer video tutorials that cover a wide range of Excel features.
- Books and E-books: Consider titles like “Excel 2007 For Dummies” for a comprehensive guide.
- Forums and Communities: Join online forums like r/excel on Reddit for discussions and solutions from fellow Excel users.
By utilizing these resources alongside this guide, you'll be well-equipped to master table creation in Excel 2007 and enhance your overall productivity.
 admin
admin