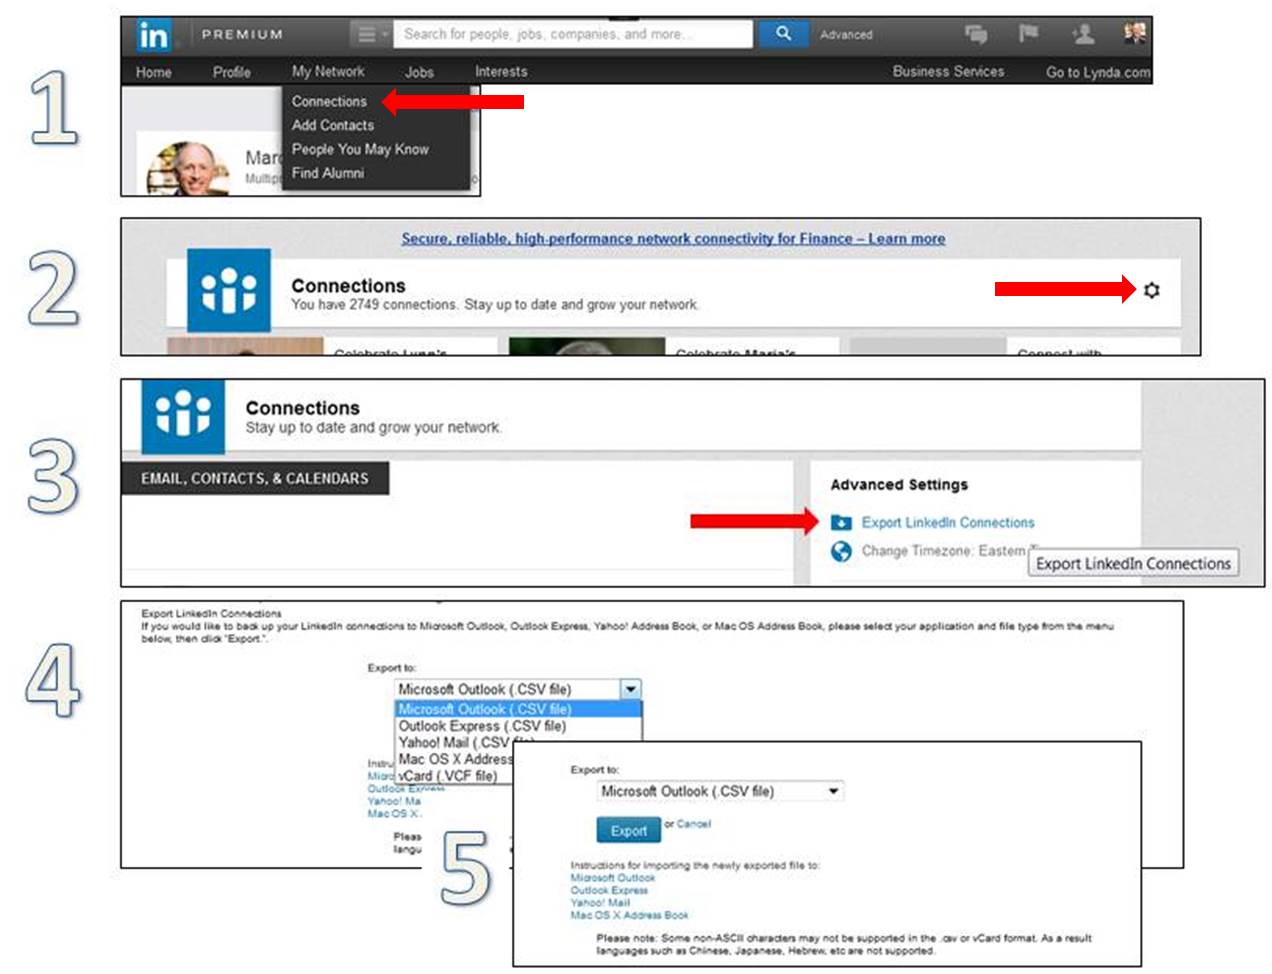
In today’s digital world, tracking your social media performance is essential for growth and networking. One of the most powerful platforms for professionals is LinkedIn. Understanding how to effectively use LinkedIn Analytics can help you make informed decisions about your marketing efforts. In this guide, we’ll explore how to export your
Understanding LinkedIn Analytics

LinkedIn Analytics is a robust tool that provides valuable insights into how your content is performing on the platform. Whether you're managing a personal brand or a company page, these analytics are crucial for measuring engagement and understanding your audience. Let's dive into the key components of LinkedIn Analytics:
- Follower Insights: Discover demographic information about your followers, including their job functions, seniority, and locations. This helps you tailor content that resonates with your audience.
- Content Performance: Track how well your posts and articles are performing. Metrics like views, likes, comments, and shares offer a snapshot of engagement levels.
- Engagement Metrics: Evaluate how your audience interacts with your content. High engagement rates indicate that your content is relevant and appealing to your followers.
- Profile Views and Searches: This helps you understand how often people are viewing your profile and from where your views are coming, making it easier to adjust your visibility and engagement strategies.
- Conversion Tracking: If you have specific goals, such as clicks to a website or job applications, conversion tracking can show you how well your LinkedIn content drives these outcomes.
Understanding these analytics will empower you to make data-driven decisions, optimize your content strategy, and ultimately grow your presence on LinkedIn. Ready to dive deeper into your analytics? Let’s learn how to export this data to Excel!
Why Export Data to Excel?

Exporting LinkedIn analytics data to Excel may seem like an extra step, but it offers a wealth of benefits that can make managing your professional presence more efficient. Here’s why you should consider it:
- Data Organization: Excel allows for better organization of your data. You can manipulate, filter, and sort your analytics according to your needs. Want to see which posts performed best last month? Or how your follower count has changed over time? Excel makes these tasks a breeze!
- In-Depth Analysis: With Excel, you can perform deep dives into your metrics. You can create visualizations such as charts and graphs to illustrate your performance over time. This can be incredibly useful for presentations or simply to track your progress.
- Custom Reporting: Automated reports can be a bit rigid. By exporting your data, you can create custom reports tailored specifically to your audience or purpose. You decide what metrics matter most, and present them in the most compelling way.
- Data Sharing: Sharing insights with team members or stakeholders is much easier with Excel files. You can send a spreadsheet, which is often simpler than navigating through LinkedIn itself. Plus, it’s easier for others to edit and comment on Excel documents.
- Data Backup: Having your analytics data backed up is a smart move. In case something goes wrong with your LinkedIn account or data gets changed or lost, you’ll have a secure copy stored offline.
Step-by-Step Guide to Export LinkedIn Analytics Data
Now that you know why exporting data is beneficial, let’s dive into the nitty-gritty of how to do it! Follow these steps to seamlessly export your LinkedIn analytics data to Excel:
- Log into Your LinkedIn Account: Begin by logging into your LinkedIn profile. Make sure you have the correct credentials handy!
- Navigate to LinkedIn Pages: If you manage a LinkedIn Company Page, go to your page. From there, look for the Analytics tab on the top navigation bar.
- Select Analytics Type: In the Analytics tab, choose from several options—Posts, Followers, and Engagement are common. Click on the section relevant to the data you want to export.
- Set the Date Range: Adjust the date range to capture the specific time period you need. This allows you to focus on recent trends or past performance.
- Click on Export: Look for the Export button, which is usually located on the upper right side of your analytics page. Click this button to initiate the download process.
- Choose Your Format: LinkedIn typically offers CSV format for downloads. This is perfect for Excel, so select this option if prompted.
- Open the File in Excel: Once the file is downloaded, locate it on your computer and open it with Microsoft Excel. You’re now ready to analyze and manipulate the data!
And there you have it—a straightforward way to export your LinkedIn analytics data! Now, you can dive deep into your insights and make data-driven decisions with confidence.
Common Challenges and Solutions
Exporting LinkedIn analytics data to Excel can be a game-changer for marketers, but it’s not without its challenges. Let’s talk about some of the common hurdles you might encounter and how to overcome them.
- Data Formatting Issues: Once your data is in Excel, you may notice that it doesn’t look the way you expected. Sometimes, dates might display incorrectly or numbers might be formatted as text.
- Limited Data Range: LinkedIn might not export all the data you’re interested in, either due to API limitations or filter settings.
- Data Overload: LinkedIn analytics can present a lot of numbers and metrics, which may overwhelm you during analysis.
- Integrating Data: If you’re using multiple platforms for insights, consolidating data can be tricky.
Solution: A quick fix is to format the cells correctly. Highlight the column, then right-click and choose 'Format Cells.' You can select the appropriate format, ensuring everything displays as intended.
Solution: Before exporting, double-check your filters and make sure you’re applying them correctly. If data is still missing, consider exporting different data sets over time to get a fuller picture.
Solution: Prioritize key metrics that are most relevant to your goals. Create a summary dashboard in Excel to help you visualize important trends without getting lost in the details.
Solution: Utilize Excel’s Power Query feature to merge different data sources easily, streamlining your analysis process.
Best Practices for Analyzing Your Data in Excel
Now that you’ve successfully exported your LinkedIn analytics to Excel, how do you make the most of it? Here are some best practices to keep in mind while analyzing your data.
- Clean Your Data: Before diving into analysis, take the time to clean your data. Remove duplicates, correct errors, and ensure consistency.
- Utilize Visuals: Excel offers various charts and graphs that can make data interpretation easier. Use pie charts for proportions and bar graphs for comparisons.
- Pivot Tables: Leverage Pivot Tables for quick summaries and comparisons. They allow you to slice and dice data effortlessly, revealing insights that may not be apparent at first glance.
- Set Clear Goals: Analyze your data with specific goals in mind. Whether you’re tracking engagement or lead generation, aligning your analysis with your objectives can yield more actionable insights.
- Regular Updates: Make it a habit to update your Excel sheet regularly. Consistent tracking will help you observe trends over time and make informed decisions.
- Document Findings: Don't forget to document your insights and observations clearly. This makes it easier to communicate findings with your team and refer back to your analysis in the future.
By following these best practices, you’ll enhance your ability to analyze LinkedIn analytics data effectively, leading to better decision-making and improved performance.
Exporting LinkedIn Analytics Data to Excel: A Comprehensive Guide
LinkedIn is a powerful platform for professionals and businesses, providing valuable analytics that can help guide your marketing strategies and content performance. Exporting these analytics to Excel can simplify data analysis, allowing for deeper insights and better decision-making. This guide walks you through the steps for exporting your LinkedIn analytics data to Excel.
Here’s a step-by-step breakdown of the process:
- Log into Your LinkedIn Account: Start by logging into your LinkedIn profile where you manage your page or account.
- Navigating to Analytics: Go to your LinkedIn page and click on “Analytics” from the menu. You will find various metrics related to your posts, audience, and engagement.
- Select the Desired Metrics: Choose the specific metrics you want to export. Options typically include:
- Profile Views
- Post Impressions
- Engagement Rates
- Follower Growth
- Choose the Date Range: Set the time frame for which you want to gather data. This can usually be done through a calendar tool available in the analytics section.
- Export to Excel: Look for the “Export” button or option, typically on the top right corner of the analytics page. Select “Excel” as your export format and download the file.
This action will generate an Excel spreadsheet containing all your selected LinkedIn analytics data, organized for easy analysis.
| Attributes | Description |
|---|---|
| Profile Views | Number of views on your LinkedIn profile over a specific period. |
| Post Impressions | Total times your posts appeared to LinkedIn users. |
| Engagement Rates | Overall engagement as a percentage of total views. |
| Follower Growth | Net increase or decrease in followers over a specified timeframe. |
With these insights at your fingertips, you can create better content strategies, track progress over time, and maximize your presence on LinkedIn. Exporting your LinkedIn Analytics data to Excel not only saves time but also provides a more comprehensive way to visualize and analyze your performance.
In conclusion, regularly exporting and analyzing your LinkedIn analytics data in Excel can significantly enhance your social media strategy and improve overall engagement.


