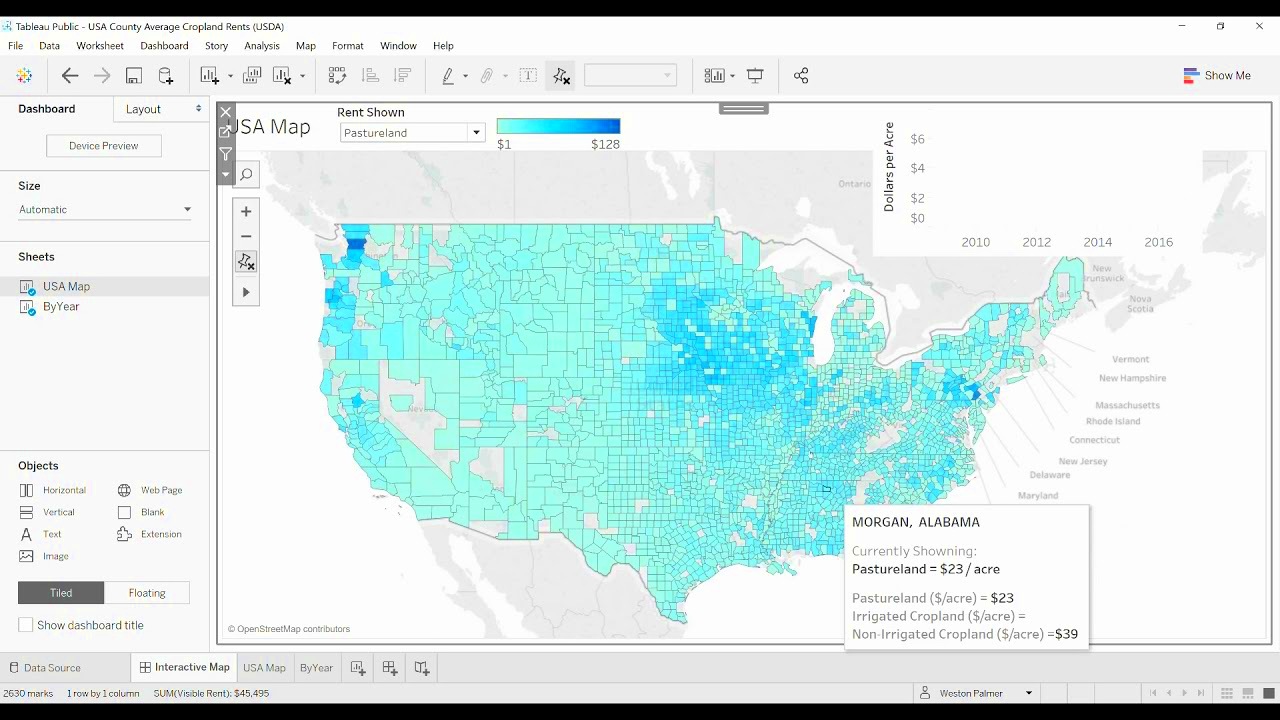
Tableau is a powerful data visualization tool that allows you to create interactive dashboards and reports. It enables users to visually analyze data and make informed decisions with ease. One of the most exciting aspects of Tableau is its interactive features, which can make dashboards more engaging and informative. By using actions like clicking and hovering, you can allow users to interact with the data in meaningful ways.
Interactive features in Tableau can transform static data into a dynamic experience. With these features, you can trigger actions, such as loading images or changing data views, based on user interaction. This helps make your reports not only visually appealing but also user-friendly and responsive. Whether you're showcasing images, filtering data, or navigating through a dashboard, Tableau offers a lot of flexibility for enhancing your visuals.
Understanding Click and Hover Events in Tableau
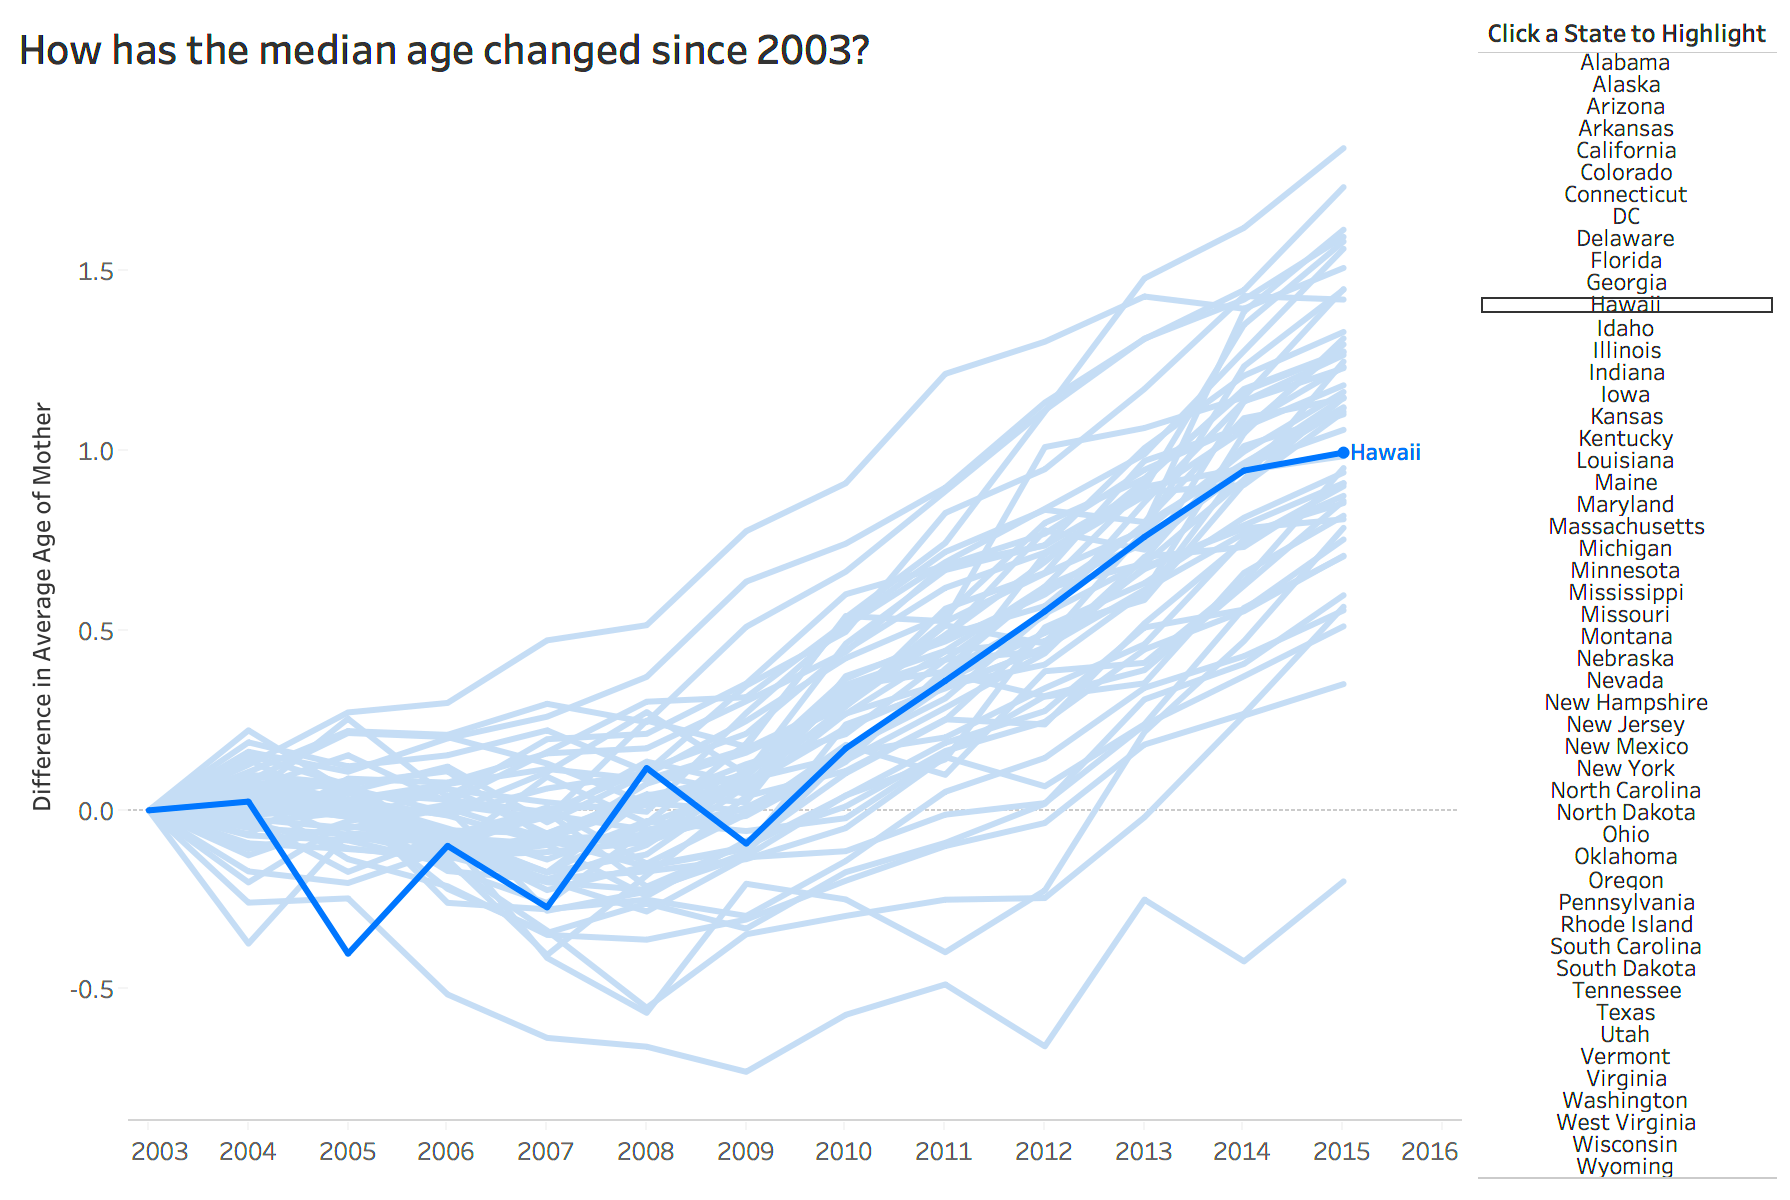
Click and hover events are two of the most commonly used interactive actions in Tableau dashboards. These actions allow users to engage directly with the data, making the experience more intuitive and tailored to their needs.
Click Events: A click event happens when a user clicks on a specific element in your dashboard, such as a bar chart or a button. This action can trigger a wide range of responses, including opening new sheets, filtering data, or, in this case, loading images.
Hover Events: A hover event is triggered when a user hovers their mouse over a specific part of the dashboard. This action can be used to reveal additional information, highlight a data point, or even show an image. Unlike click events, hover actions don’t require a user to click anything; they only require the mouse to be placed over a specific area.
Both actions are essential tools for creating a more interactive and user-friendly Tableau dashboard. They allow you to provide additional context or details without cluttering the interface with too much information.
How to Load Images on Click Events in Tableau
Loading images on click events in Tableau is a great way to enhance user experience by displaying relevant visuals when a user interacts with the dashboard. Here’s how you can do it:
- Step 1: Prepare your images. Ensure that the images you want to display are accessible online or hosted on your Tableau Server or Tableau Public account.
- Step 2: Create a calculated field. You will need to create a calculated field that contains the URL or file path of the image you want to display. The field should return the image path when a specific condition is met (like clicking on a certain data point).
- Step 3: Set up the action. In Tableau, navigate to the “Dashboard” menu and select “Actions.” From there, create a new action where the source field is your click event, and the target is your image URL field. Set the action type to “URL” to display the image.
- Step 4: Test the action. Once you’ve set up the action, test it by clicking on the specified data point or element to ensure that the image loads correctly.
This method can be applied to display any type of image, such as product photos, maps, or charts, based on user interaction. Using click events for image loading makes the dashboard feel interactive and responsive, allowing users to explore different visual content without leaving the page.
Steps to Set Up Image Loading on Hover Events

Loading images on hover events in Tableau adds an interactive touch to your dashboard, where users can view images just by hovering over an element. This can be used for product images, detailed views, or additional context without cluttering the dashboard. Here’s how you can set it up:
- Step 1: Prepare your image URLs. Before you begin, ensure that the images you want to load are available on the web or in a shared location where Tableau can access them.
- Step 2: Create a calculated field. In Tableau, go to the Data pane, and create a calculated field that returns the URL of the image based on the data point being hovered over. For example, you can create a field that displays different images based on category, region, or any other parameter.
- Step 3: Set up the hover action. From the “Dashboard” menu, go to “Actions,” then select “Add Action” and choose “Change Filter” or “URL” action, depending on how you want the image to display. Choose the calculated field as the source, and ensure the action is triggered when hovering over a certain area or data point.
- Step 4: Test the setup. Preview the dashboard and hover over the elements to check if the images load as expected. Make sure they are responsive and load quickly to provide a smooth user experience.
Hover actions are subtle but effective ways to provide additional information and enhance the interactivity of your Tableau dashboards. They let users explore more details without having to click on anything, improving both functionality and the user experience.
Best Practices for Using Click and Hover Events with Images
Using click and hover events in Tableau with images can create a more engaging and interactive dashboard, but it’s important to follow best practices to ensure usability, performance, and design coherence. Here are some tips:
- Keep it simple: Use hover and click actions sparingly. Too many interactions can overwhelm users and make the dashboard feel cluttered. Only trigger images when they add value to the user experience, such as when additional details or visual context are needed.
- Optimize image size: Ensure that the images you use are optimized for web use. Large, uncompressed images can slow down your dashboard’s performance, especially when multiple images are loading simultaneously.
- Provide clear feedback: Users should know what to expect when they click or hover. Consider adding hover tooltips or visual cues (like a change in cursor) to let users know that an action is available.
- Limit the number of images: While images can enhance a dashboard, too many images may overwhelm the user or impact the dashboard’s load time. Aim for a balance between visuals and functional data.
- Test responsiveness: Make sure the images load quickly and correctly across different devices and screen sizes. Test your actions in Tableau’s preview mode to ensure that everything works smoothly.
- Use descriptive image titles: If you use images to convey specific data points or categories, make sure each image is named descriptively, so users can understand the context of the image at a glance.
By following these best practices, you can create a more engaging and efficient Tableau dashboard that improves user interaction without sacrificing performance.
Common Issues and Troubleshooting Tips
While setting up image loading on click and hover events in Tableau can be a powerful tool for creating interactive dashboards, users may encounter a few issues along the way. Below are some common problems and troubleshooting tips to help you resolve them:
- Images not loading: If your images aren’t loading, double-check the URLs or file paths used in the calculated fields. Make sure that the image files are accessible and that the correct path is entered in Tableau.
- Slow image loading: Slow image loading can be caused by large file sizes or slow internet connections. To resolve this, compress your images to a smaller size or consider hosting the images on a faster server.
- Hover actions not working: If hover actions aren’t triggering properly, ensure that the action type is set correctly (e.g., URL or Filter). Also, check that the fields you’ve set for the hover action are correctly configured to match the data points you want to trigger the image on.
- Click actions not responsive: If clicking on an element doesn’t load the image, check that the source and target sheets for your click actions are correctly set up. Additionally, make sure the action is properly linked to the calculated field containing the image URLs.
- Dashboard performance issues: Too many images or complex actions can impact Tableau’s performance. Reduce the number of images, optimize file sizes, or simplify the actions to improve responsiveness.
- Image resolution issues: If images appear blurry or pixelated, ensure they are high-quality and appropriate for the display size. Low-resolution images may not look sharp when enlarged or when displayed on high-resolution screens.
By addressing these common issues, you can ensure a smoother experience for users and make your image-based interactions work seamlessly in Tableau.
Advantages of Using Images in Tableau Dashboards
Incorporating images into Tableau dashboards can significantly enhance the user experience and provide more context to the data. Images are a powerful tool for making dashboards more visually appealing and intuitive, while also adding an extra layer of information. Here’s why you should consider using images in your Tableau dashboards:
- Improved Visual Appeal: Images make dashboards look more engaging and less static. By including product photos, charts, or infographics, you can create a more visually rich experience that draws users in.
- Increased Data Understanding: Sometimes, data alone can be hard to interpret. Images can help users better understand the data by providing context. For instance, showing a map of locations, product images, or other relevant visuals makes complex data more accessible and easy to grasp.
- Better Engagement: Interactive images (loaded via hover or click actions) encourage users to engage more with the dashboard. This not only makes the data more interesting but also encourages exploration and discovery of deeper insights.
- Enhanced Storytelling: Images help tell a story alongside the data. Whether you’re showcasing product details, showing geographic trends, or illustrating performance metrics, images can make the narrative more compelling and relatable.
- Clearer Branding: For companies looking to create branded dashboards, including logos, product images, or visual themes can reinforce the company’s identity, making the dashboard feel more cohesive and professional.
- Personalized User Experience: By displaying images based on specific data points (like regions, products, or categories), you can personalize the experience for the user, making the dashboard feel more tailored and relevant.
Using images in Tableau dashboards not only makes the experience more engaging but also helps users gain insights faster and in a more intuitive manner. It’s a simple yet effective way to take your dashboard to the next level.
Conclusion: Enhancing User Experience in Tableau with Image Interactions
Integrating images into Tableau dashboards, especially through interactive elements like click and hover actions, can dramatically improve the user experience. By offering visuals alongside data, you help users better understand complex information, enhance engagement, and create a more immersive environment for exploring insights.
Click and hover events provide a dynamic layer to your dashboards, turning them from static data representations into interactive and engaging experiences. By carefully selecting when and how to display images, you ensure that your dashboard remains clear, user-friendly, and visually appealing.
Remember, it’s important to follow best practices for optimizing image sizes, testing performance, and ensuring responsiveness. Overloading the dashboard with too many images or complex actions can slow down the experience. But with thoughtful design, image interactions can enhance the overall effectiveness of your Tableau dashboards, making them not just tools for analysis, but interactive, visually-driven platforms for data exploration.
FAQ
1. Can I use any type of image in Tableau?
Yes, you can use various types of image formats in Tableau, such as JPG, PNG, and GIF. The key is ensuring that the images are hosted online or accessible to Tableau through URLs or file paths, so they can be dynamically loaded when needed.
2. How do I improve the performance of my Tableau dashboard with images?
To ensure fast performance, optimize your images by reducing their file sizes without compromising quality. You can also limit the number of images on a single dashboard and consider lazy loading techniques, where images are only loaded when needed (e.g., when a user clicks or hovers).
3. Can I use images for all actions in Tableau?
Yes, images can be used in various types of actions, including filtering, URL links, and showing/hiding visuals. You can even set up dynamic images that change based on the data selected, giving users a personalized experience.
4. What’s the difference between using images for click and hover actions?
Click actions require the user to click on an element (e.g., a bar or button) to display an image, whereas hover actions display images when the user’s cursor hovers over an element without the need for clicking. Hover actions tend to provide quicker, less intrusive interactions, while click actions allow for more deliberate user engagement.
5. Are there any limitations when using images in Tableau?
While Tableau is highly flexible, there are limitations regarding the image file size and the number of images that can be used effectively. Large images can slow down your dashboard’s performance, and displaying too many images might overwhelm the user. It’s best to balance visual appeal with functionality.
