Realistic Circular Diagram Infographic – Free Download
Realistic Circular Diagram Infographic – Vector Templates
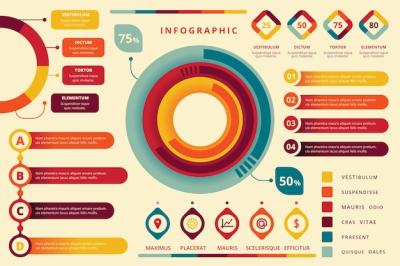
Welcome to our collection of vector templates. This realistic circular diagram infographic is designed to help you present your data in an engaging and easy-to-understand format. Whether you're preparing a presentation, report, or any visual content, this infographic template will add clarity to your ideas.
Key Features
- File Types: Available in both EPS and JPG formats, ensuring compatibility with various graphic design software.
- Editable Design: Customize colors, sizes, and text to match your brandâs style or your personal aesthetics.
- High Quality: Crisp, clean lines and smooth curves make your infographic look polished on any screen or print.
- Versatile Use: Ideal for business reports, educational materials, social media graphics, and more.
Why Choose Our Circular Diagram Infographic?
This template is not just visually appealing; it is also functional. Conveying information effectively is crucial, and our infographic serves this purpose beautifully. With a circular layout, it helps illustrate relationships and proportions easily, making complex data simpler to digest.
How to Use This Template
Using this reactive circular diagram infographic is straightforward:
- Download the template in your preferred file format (EPS or JPG).
- Open the file using your chosen graphic design software.
- Customize the infographic by adjusting colors, sizes, and text.
- Save your changes and export your final design for use in your project.
Who Can Benefit from This Infographic?
This infographic is suitable for anyone looking to enhance their visual communication. Here are some groups that may find it particularly useful:
- Businesses: Create compelling presentations and reports that impress stakeholders.
- Students: Present data in a clear and engaging manner in school projects.
- Marketers: Showcase statistics in eye-catching graphics for marketing materials.
- Educators: Use it as a teaching tool to explain complex concepts easily.
Conclusion
If you are looking for a practical and visually appealing way to represent data, our realistic circular diagram infographic is a perfect choice. With its easy-to-use format and flexible design, this vector template can help you communicate your ideas effectively. Get started today and see how it can enhance your presentations and projects.
