You might also like


Five Statistics Charts Templates Set – Download Free Stock Photo
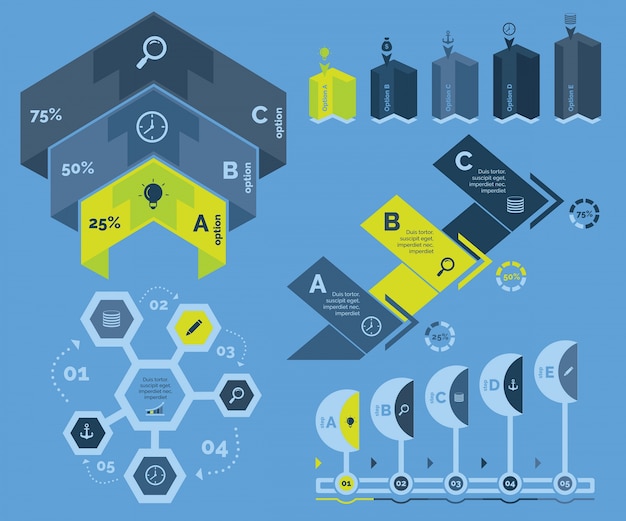
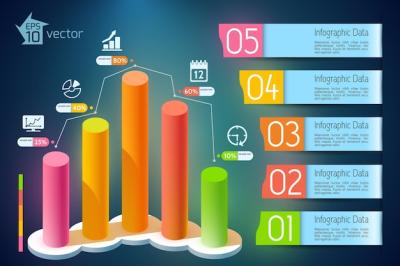
Five Statistics Charts Templates Set
Are you looking for a way to present your data clearly and effectively? The Five Statistics Charts Templates Set is here to help. These templates are designed to make your information easy to understand, whether youâre creating an infographic, a report, or a presentation. Each template in this set can be easily customized to suit your needs.
Whatâs Included in the Set?
This template pack includes five unique charts, each crafted to highlight different types of data. You will receive:
- Bar Chart Template - Perfect for comparing categories of data.
- Pie Chart Template - Great for showing proportions and percentages.
- Line Chart Template - Ideal for displaying trends over time.
- Area Chart Template - Useful for cumulative totals over time.
- Scatter Plot Template - Excellent for showing relationships between two variables.
File Formats
The templates are provided in EPS and JPG file formats, making them compatible with various design software. You can easily edit and modify these templates to fit your project perfectly.
Why Use These Templates?
Using templates can save you valuable time and effort. Here are a few reasons why this set is a great choice for your next project:
- Easy to use and customize according to your needs.
- Professional design ensures your data is presented beautifully.
- Versatile formats allow for use in multiple applications.
- Perfect for beginners and experienced designers alike.
Who Can Benefit from These Templates?
This set is ideal for:
- Business professionals presenting reports
- Students working on assignments
- Marketers creating informative visuals
- Anyone who wants to present data in a clear and compelling way
Get Started Today
Don't let your important data get lost in a sea of text. With the Five Statistics Charts Templates Set, you will have the tools you need to showcase your information effectively. Visit HD Stock Images to download your set and start creating stunning visuals that communicate your data clearly.