Climate visualization has been a great innovative technology that helps to unveil the complexity and magnitude of the environment- climate changes. More often than not, pictures depict what it means when we talk about climate change in pictures.
In this blog post, we are going to show how different parts of America have varied climate zones, as well as their trends in terms of temperature and precipitation. Therefore, this exploration is meant to make people aware of climate changes so that they can take action against these devastating problems facing humankind today.
Understanding Climate Change and Its Impact
Long-term changes in temperature, precipitation, and other atmospheric conditions are referred to as climate change. The manifestations of its effects are everywhere; weather patterns, rising sea levels and loss of biodiversity are among the areas that have been affected by climate change. Below are some of the major consequences of climate change:
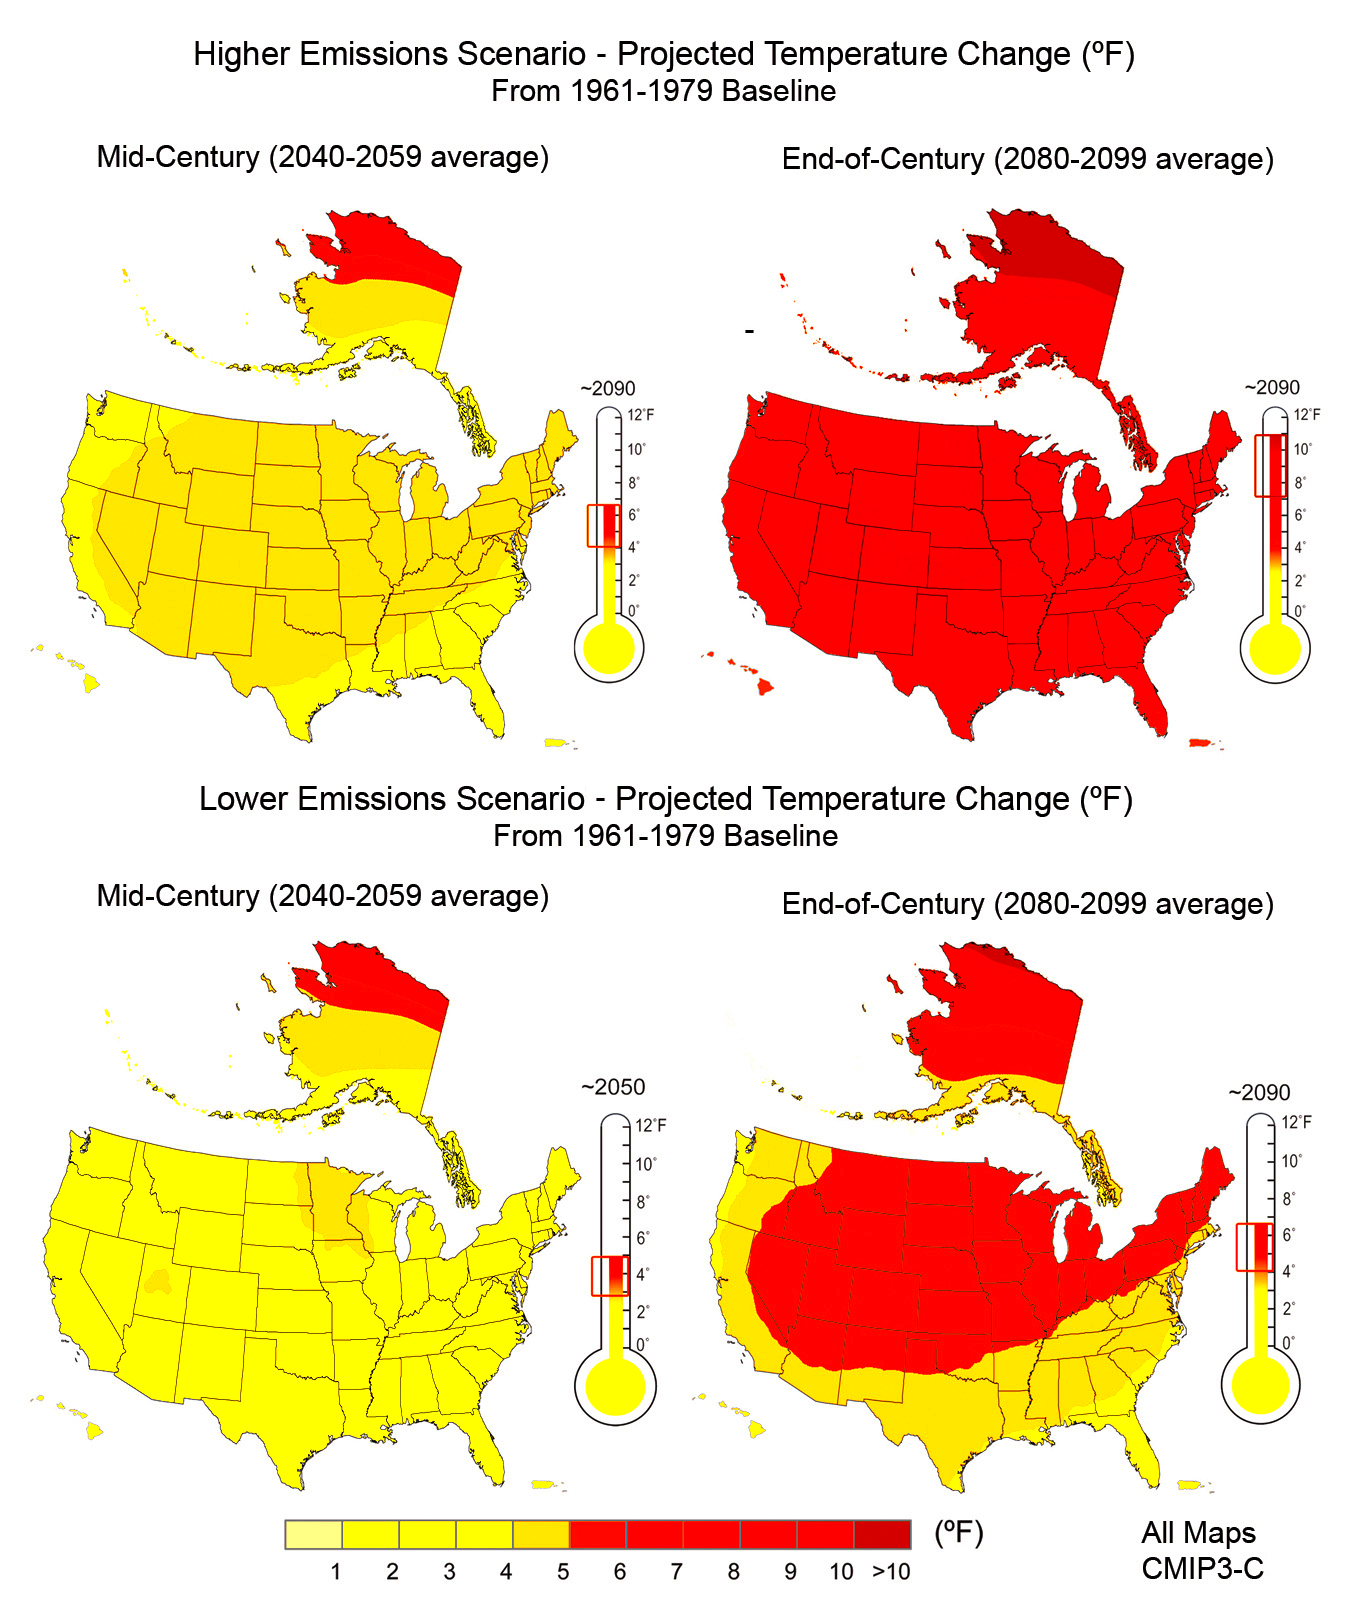
- Increased Temperatures: Average temperatures have risen significantly, leading to more heatwaves.
- Extreme Weather Events: Storms, hurricanes, and droughts are becoming more intense and frequent.
- Rising Sea Levels: Melting ice caps and glaciers are contributing to higher sea levels, threatening coastal communities.
- Loss of Biodiversity: Many species are at risk due to changing habitats and ecosystems.
For the development of strategies aimed at reducing their effects, it is necessary to understand these impacts as this will help in preserving our Earth for those who come after us.
Importance of Visual Representation of Climate Data
Climate data being visually portrayed has a number of essential functions. The following are some of the reasons as to why it is important:
| Benefits |
Description |
| Clarity |
Images simplify complex data, making it easier for people to grasp the implications of climate change. |
| Engagement |
Visuals attract attention, encouraging individuals to engage with climate topics actively. |
| Education |
Pictures can educate the public about climate issues, fostering a deeper understanding of environmental challenges. |
| Advocacy |
Visuals can be powerful tools for advocacy, helping to convey urgent messages about the need for action. |
To sum up, climate data visualization not only helps us to comprehend the present context but also aspires us with optimism and prompts for fighting against climate change.
Key Climate Zones Across the USA
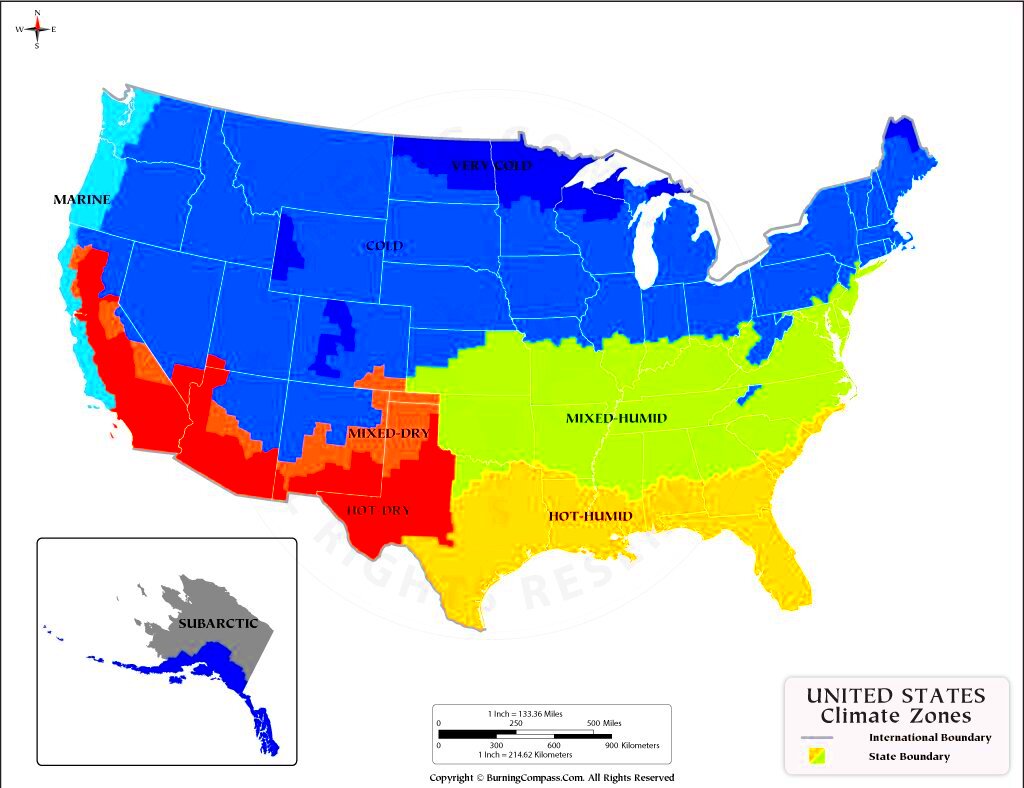
Each climate zone in the United States has its own unique features that are characteristic to it. This helps us understand visually climate change in various regions. The following is an overview of major climate zones quickly:
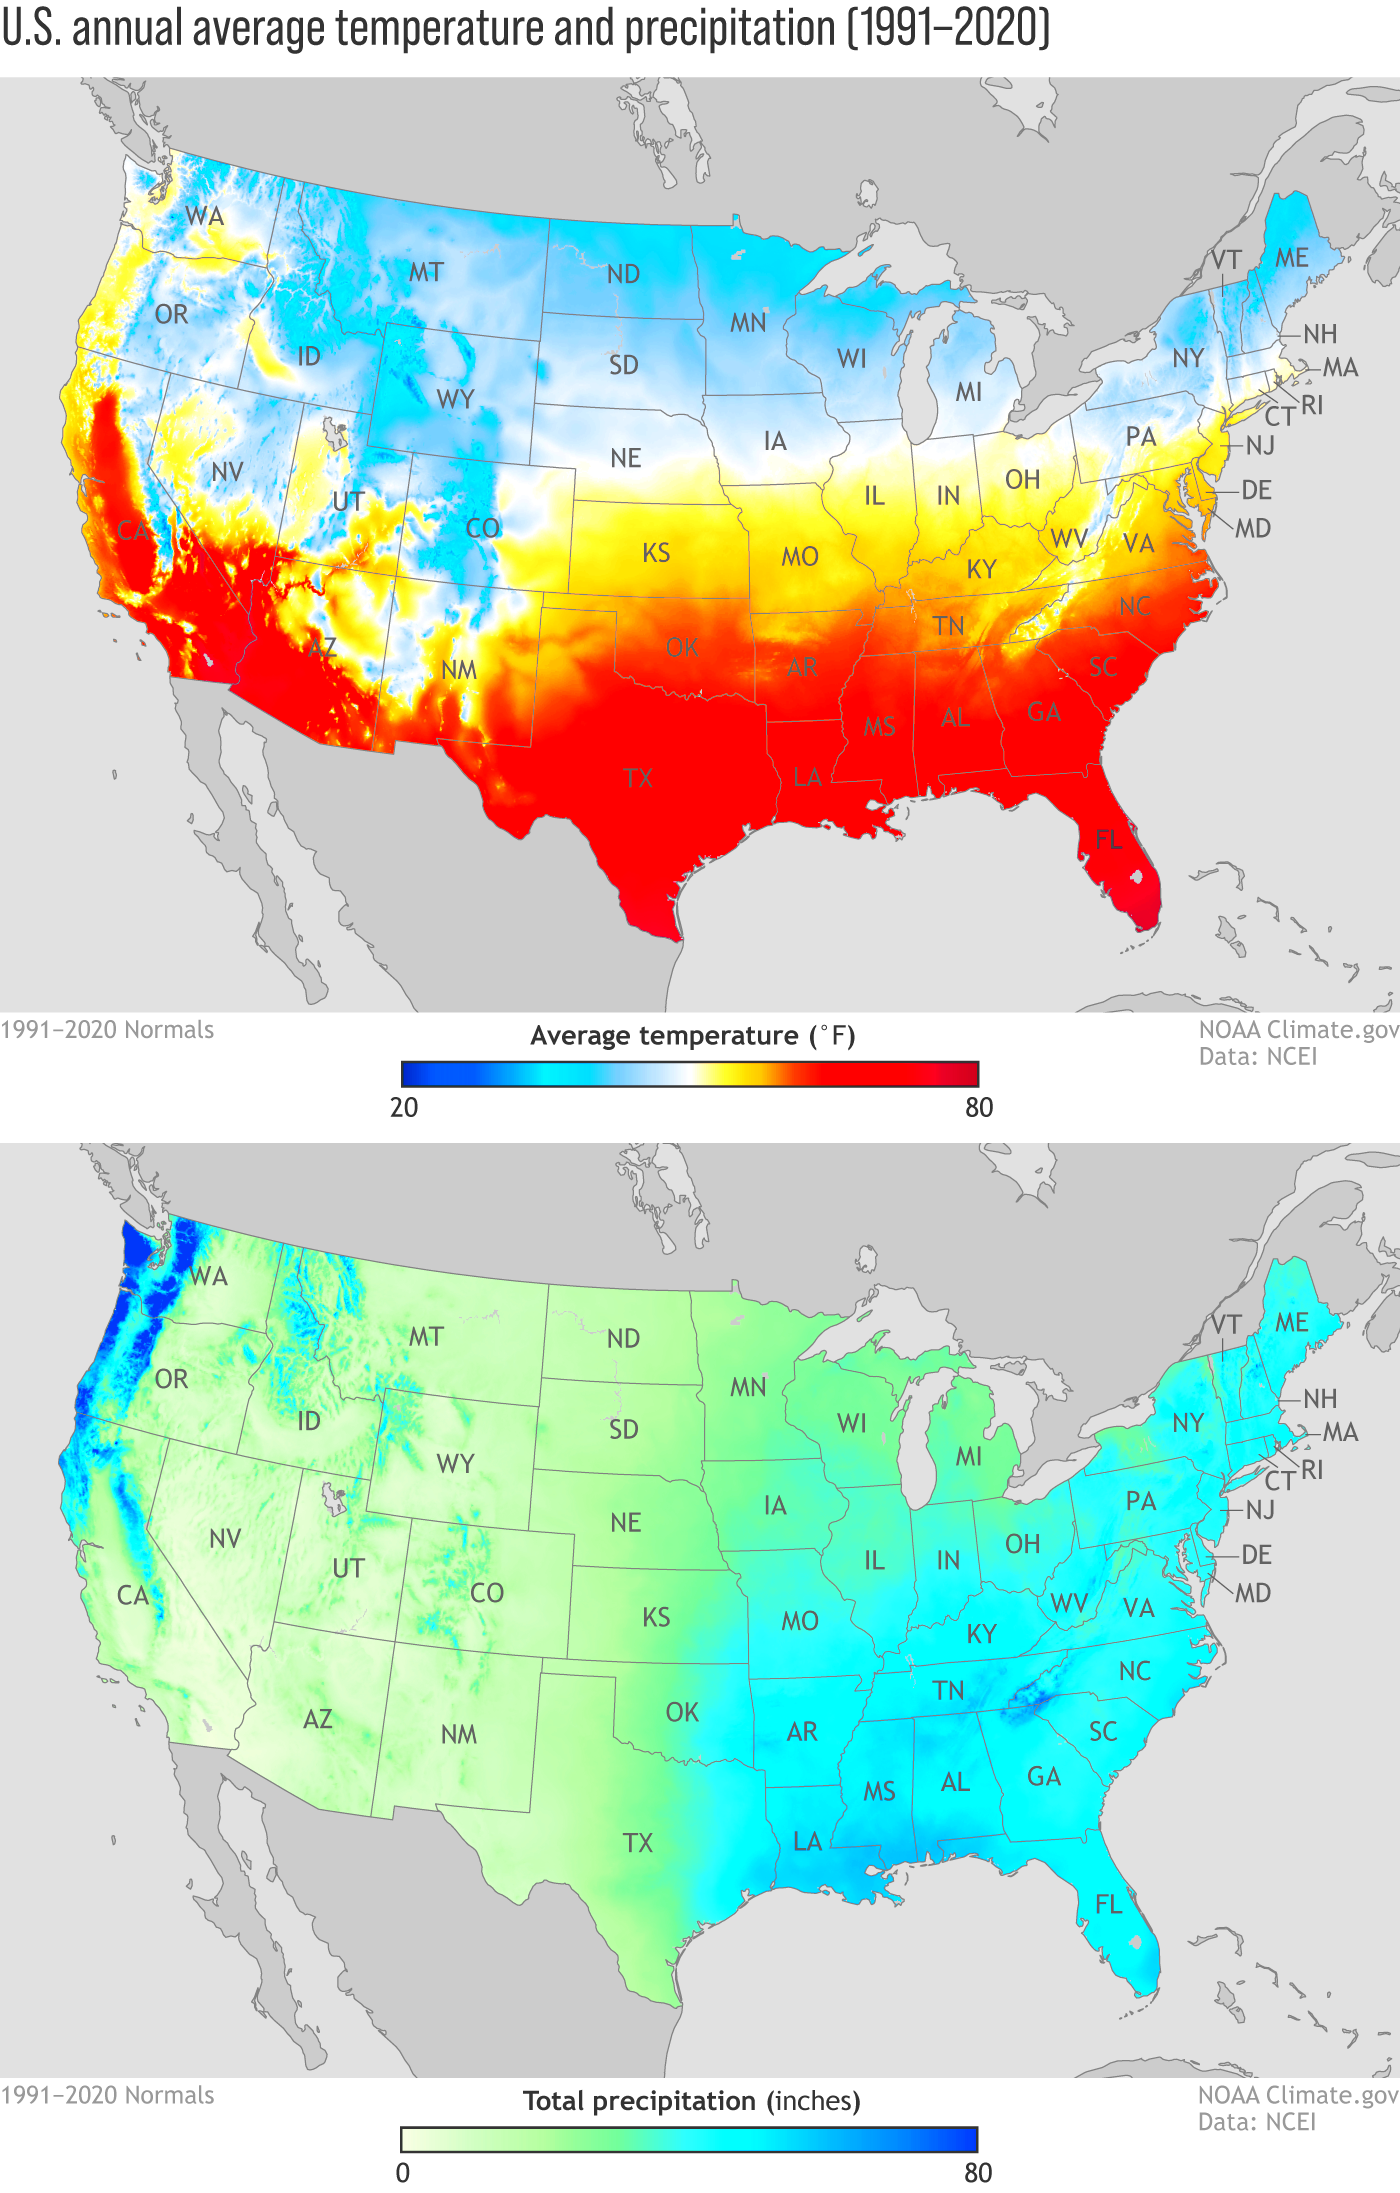
- Tropical: Found in southern Florida, this zone experiences warm temperatures year-round with significant rainfall.
- Dry: The Southwest, including parts of California and Nevada, has arid conditions, characterized by low rainfall and high temperatures.
- Coastal California has a Mediterranean climate with warm, dry summers and cool, wet winters.
- Humid Subtropical: The Southeastern states, like Georgia and Alabama, have hot, humid summers and mild winters.
- Continental: Areas like the Midwest experience four distinct seasons, with cold winters and warm summers.
- Polar: Alaska features polar climates, with extremely cold temperatures and limited vegetation.
In view of the fact that every area has its unique way of dealing with climate change, it is thus necessary to apply different visual aids so as to convey such differences.
Using Pictures to Depict Climate Variations
An effective way to demonstrate climates in various regions is through the usage of pictures that can range from lush forests to arid deserts. There are several ways in which we can use photographs to comprehend these climate variances:
- Comparative Images: Side-by-side comparisons of before-and-after pictures can showcase the impact of climate change on landscapes.
- Infographics: Visuals that combine data with images can simplify complex information, making it more digestible.
- Documentary Photography: Capturing real-life scenarios helps to convey emotional stories behind climate change.
- Aerial Photography: High-altitude images provide a unique perspective on large-scale changes, like deforestation or urbanization.
Employing a wide variety of
images can help in understanding weather fluctuations and their impact.
How to Access High-Quality Climate Images
It is recommended that you choose top-quality climate pictures for effective visualisation of climate data. Reliable sources of this kind include:
| Source |
Description |
| Stock Image Websites: |
Websites like HD Stock Images offer a range of climate-related images that can be used for various projects. |
| Government Agencies: |
Agencies like NASA and NOAA provide public access to a wealth of climate data and images. |
| Research Institutions: |
Universities often publish studies with accompanying visuals, which can be a great resource. |
| Social Media: |
Platforms like Instagram and Pinterest can showcase user-generated content related to climate change. |
For all visual contents just confirmed that they were allowed for usage in the projects. These resources are necessary to help you with finding awesome
images that give life to the climate statistics!
Best Practices for Using Climate Images in Your Projects
Your undertaking will receive a significant boost through employing climate-related pictures. Yet, if you want to make sure that your
images are serving their purpose and do not harm anyone’s feelings, there are some important things that need to be taken into consideration. Therefore, the following tips might come in handy:
- Choose Relevant Images: Make sure the images directly relate to your content. Irrelevant images can confuse your audience.
- Use High-Resolution Images: Always opt for high-quality images to ensure clarity and professionalism in your projects.
- Provide Context: Accompany images with clear descriptions or captions to explain their significance and relevance.
- Respect Copyrights: Always check the licensing of any image you use. Ensure you have the right to use the image for your intended purpose.
- Balance Text and Images: Avoid overwhelming your audience with too many images. Instead, use them to complement your text.
- Highlight Action: Use images that inspire action or evoke emotion, driving home the urgency of climate issues.
Adhering to the recommended practices according to this way, one enable to send the right message about how significant climate changes are alongside ensuring that their projects remain attractive.
Frequently Asked Questions
In this section, we will examine the most frequently asked questions regarding climate visuals and climate photographs:
| Question |
Answer |
| Where can I find high-quality climate images? |
Websites like HD Stock Images, NASA, and NOAA provide a variety of climate images. |
| Can I use climate images for commercial projects? |
It depends on the image's licensing. Always check for permissions before use. |
| How can images influence climate awareness? |
Images can evoke emotions, simplify complex data, and engage audiences, making climate issues more relatable. |
| Is there a way to create my own climate visuals? |
Yes, you can take photographs, create infographics, or use data visualization tools to produce your own visuals. |
Conclusion and Final Thoughts
Visual representation of climate data through
images is not only a form of creation but also an important aspect of monitoring and tackling changes caused by climate. When we illustrate the data associated with climate through high resolution
images, we can express more complicated issues easily; hence engaging people better. However, you should consider relevance in the choice of your
We must use the power of pictures to communicate and call for action as we progress. Together, we can change the world by taking on climate change using pictures. This climate visualization has been an eye-opening experience, thank you for joining us!
 admin
admin