3D Donut Chart Template with Five Groups – Free Vector Download
3D Donut Chart with Five Groups Template
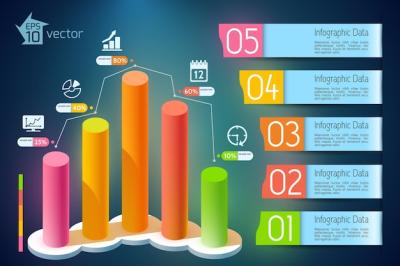
This vector template file features a visually stunning 3D donut chart with five groups, perfect for creating eye-catching and informative infographics, brochures, and presentations. Whether you need to showcase statistics, data graph, or illustrate a business diagram, this template has got you covered.
Impress with 3D Visuals
The 3D donut chart included in this template adds depth and dimension to your visuals, giving them a professional and modern look. The five groups are clearly defined, making it easy for your audience to understand the data and grasp its significance.
Informative and Versatile
With this template, you can create infographics, brochures, and presentations that are informative and versatile. Explore various ways to present your data, whether it's in a pie chart, circle diagram, or comparison infographic. The template offers endless possibilities for visually engaging content.
Designed for Business and Finance
This template is specifically designed for business and finance-related content. Whether you're preparing a financial report, analyzing market trends, or presenting data to stakeholders, this template provides the perfect visual representation. Capture attention and communicate data effectively with this professional vector template.
File Formats and Category
The file is available in EPS and JPG formats, ensuring compatibility with most design software. It falls under the category of Vector Templates, making it a valuable resource for designers, marketers, and anyone looking to create captivating visual content.
Tags
3d chart, 3d pie chart, 3d graph, pie diagram, infographics brochure, logo infographic, background infographic, business chart, graph, pie chart, circle diagram, statistics, data graph, infographic presentation, pie chart graph, graph chart, infographic layout, circle process, pie chart infographic, pie charts, circle graph, five infographic, infographic banner, circle chart, data chart, pie graph, finance infographic, data 3d, 3d infographic, comparison infographic, progress chart, statistics background, business diagram


