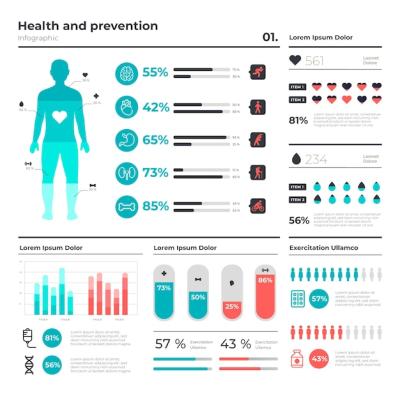
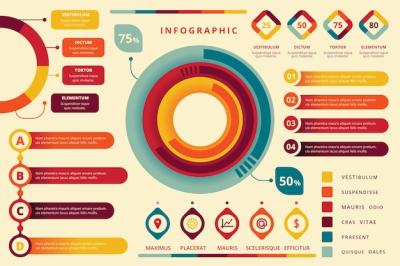
Creative Colourful Profit and Loss Infographic – Free Vector Download
About the Creative Colourful Profit and Loss Infographic
The Creative Colourful Profit and Loss Infographic is a versatile vector template file that provides a visually appealing representation of profit and loss data. It is suitable for professionals from various industries including business, marketing, and finance. The infographic can be used to present complex financial information in a clear and concise manner.
Features and Benefits
This infographic offers numerous features and benefits that make it a valuable resource for professionals:
- Development Process: The infographic helps in understanding the development process by visually illustrating the various steps involved. It simplifies complex concepts and promotes better comprehension.
- Effective Presentation: With its vibrant colours and clear design, this infographic ensures that the information is presented in an engaging and visually appealing manner. It captures the attention of viewers and keeps them interested.
- Business Growth: By visualizing the growth process through charts and graphs, this infographic aids in understanding the factors that contribute to business growth. It enables users to analyze and track their progress effectively.
- Flexible File Formats: The Creative Colourful Profit and Loss Infographic is available in both EPS and JPG file formats. This ensures compatibility with various software applications and allows for easy customization.
Usage and Applications
This Vector Templates file can be utilized in multiple ways:
- Business Infographics: It can be used to create visually appealing and informative infographics related to the business and marketing domains. Presenting data in this format makes it easier to comprehend and remember.
- Process Charts: The colourful and interactive design of this infographic is perfect for illustrating process steps and workflows. It enables users to present complex information in a simplified and visually attractive manner.
- Information Graphics: The file can be used to create attractive information graphics that convey data in a visually appealing way. The charts and graphs available in this template facilitate effective data visualization.
Overall, the Creative Colourful Profit and Loss Infographic is a powerful tool for professionals seeking to present data in a visually captivating and understandable manner. Its versatile features, flexible file formats, and wide range of applications make it a valuable addition to any toolkit.


